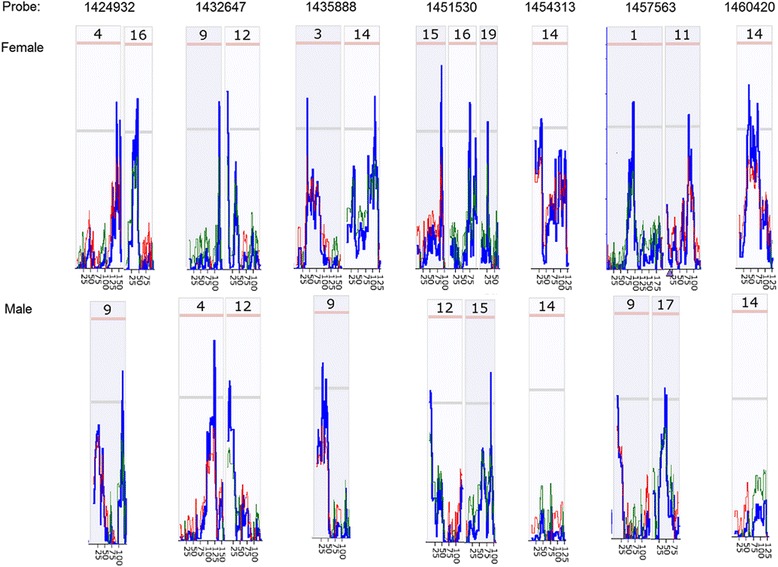
Fig. 5.

Detection of eQTL for regulation of Egfr expression levels in kidney of mouse RI strains using probes of Egfr. Top line is the numbers of Egfr probes, second line is the eQTL detected from female mice. Bottom line shows the eQTL detected from male mice. The numbers on top of each individual figure in second and bottom lines indicate the number of chromosome. Pink color lines on top of the individual figure indicate the threshold for significant level. Light grey lines indicate the threshold for suggestive level
