
Figure 6.
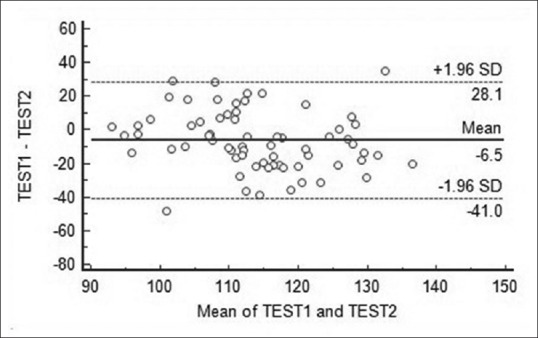
Example of a Bland–Altman plot used to compare two test methods. The bias line with the limits of agreement is provided
Official websites use .gov
A
.gov website belongs to an official
government organization in the United States.
Secure .gov websites use HTTPS
A lock (
) or https:// means you've safely
connected to the .gov website. Share sensitive
information only on official, secure websites.
Example of a Bland–Altman plot used to compare two test methods. The bias line with the limits of agreement is provided