Figure 7.

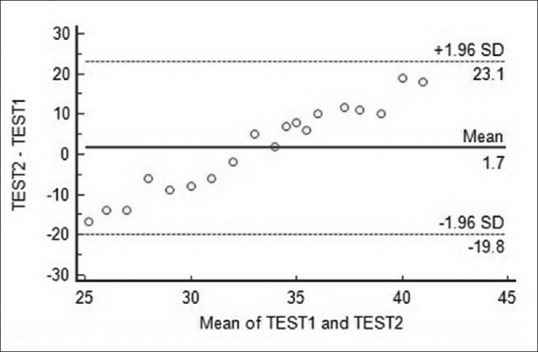
Example of a Bland–Altman plot showing proportional bias. In this case, the difference between the methods first tends to narrow down and then increase as the value of measurements increase

Example of a Bland–Altman plot showing proportional bias. In this case, the difference between the methods first tends to narrow down and then increase as the value of measurements increase