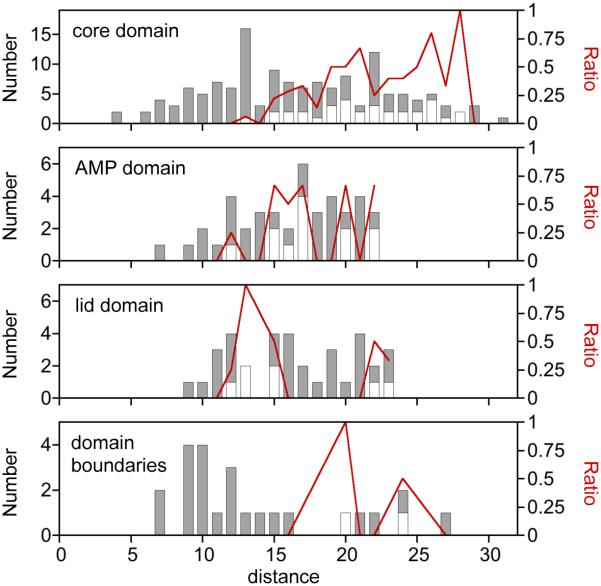
Figure 5.
Comparison of αC to γ-Pi distances within each AK domain. The dispersion of variants across the different distance values was calculated for the core, lid, and AMP binding domains. A similar analysis was performed with the domain boundary regions, defined as the six-residue window at the junction of each domain. For each domain, all of the theoretically possible permuted TnAK in our libraries (gray bars) is compared with the subset of variants that complement bacterial growth (open bars). The fraction of active variants (red line) is shown across the different values of each metric.

