
Figure 5. ROCK2 protein levels were inversely correlated with miR-101 levels in NSCLC tissue samples.
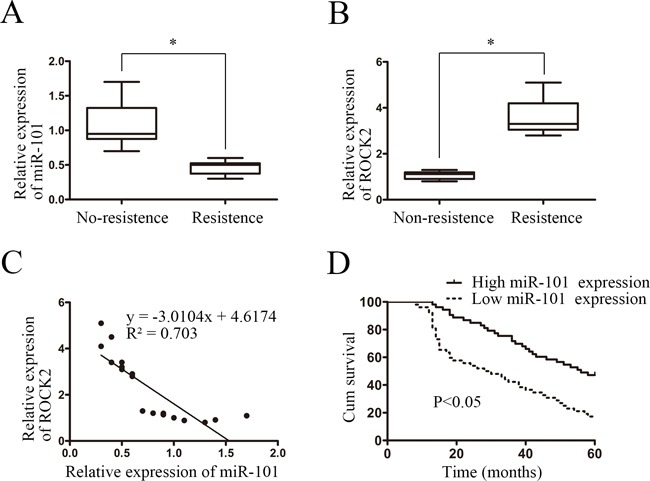
A. Real-time PCR showed that 10 chemoresistant NSCLC tissue samples had lower miR-101 expression than 10 non-chemoresistant NSCLC tissue samples (P < 0.05). B. Real-time PCR showed that ROCK2 mRNA levels were significantly upregulated in 10 chemoresistant NSCLC tissue samples compared with 10 non-chemoresistant NSCLC tissue samples (P < 0.05). C. ROCK2 upregulation was inversely correlated with the degree of miR-101 downregulation in the 10 chemoresistant NSCLC and 10 non-chemoresistant NSCLC tissue samples (R2 = 0.703, P < 0.05). D. Kaplan-Meier analysis of survival times of patients with NSCLC as a function of miR-101 levels.