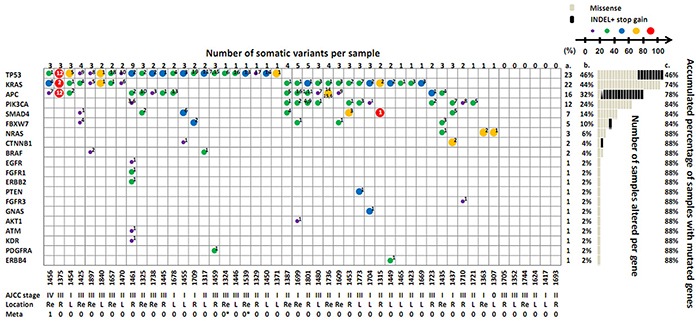
Figure 2. Distribution of 77 somatic variants on 20 genes in the 50 CRC patients.

The number on the uppermost layer represents the number of somatic variants per sample. The size and color of the circle in the cell represents the individual variant frequency. For interpreting the meaning of each symbol, please refer to the scale bar. The number labeled in the cell indicates the designated variant serial number of each gene, which are listed in Table 3. More than one number in one cell indicates multiple mutations in the same gene. The gray line at the right part of the figure indicates a missense mutation, and the black bar denotes an indel or nonsense mutation. Columns a and b denote the number and percentage of samples altered per gene; Column c denotes the accumulated percentage of samples with mutated genes. The patient information denoted at the bottom of the figure includes the tumor ID, AJCC stage, location, and metastasis condition. “Re” = rectum; “R” = right site; “L” = left site; 1 = metastasis; 0 = no evidence of metastasis; * = follow-up observation of metastasis events 1 year after surgery in 2 stage III patients.
