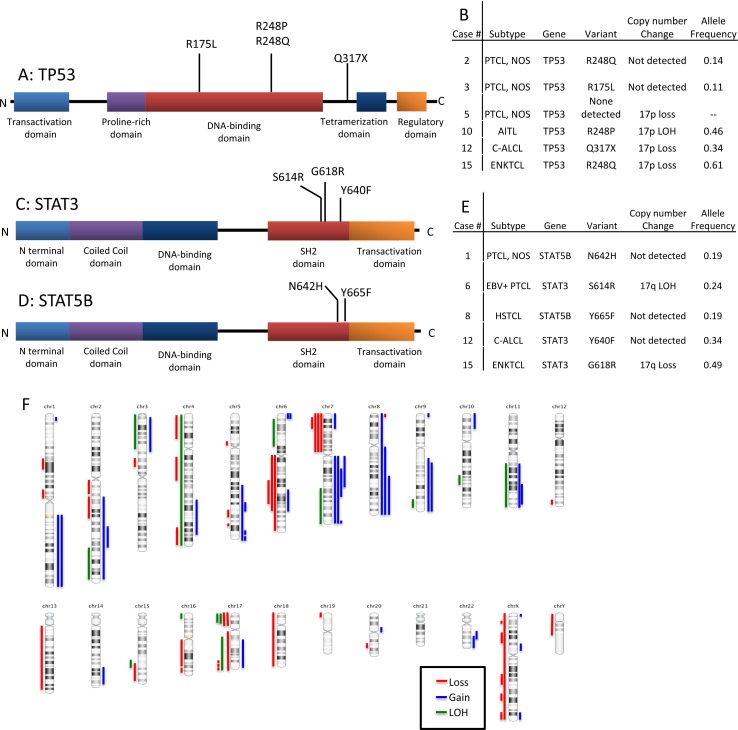
Figure 3. Schematic representation of the types and locations of TP53, STAT3 and STAT5b mutations.
A. TP53 mutations. B. Table showing T/NK-PTLD subtypes with TP53 mutation and 17p copy number changes. C. STAT3 mutations in the SH2 domain. D. STAT5b mutations in the SH2 domain. E. Table showing T/NK-PTLD subtypes with STAT3 or 5b mutations, and 17q copy number changes. F. Ideogram of copy number changes detected in 16 cases of T/NK-PTLD. Gains are indicated in blue, losses in red and LOH in green.

