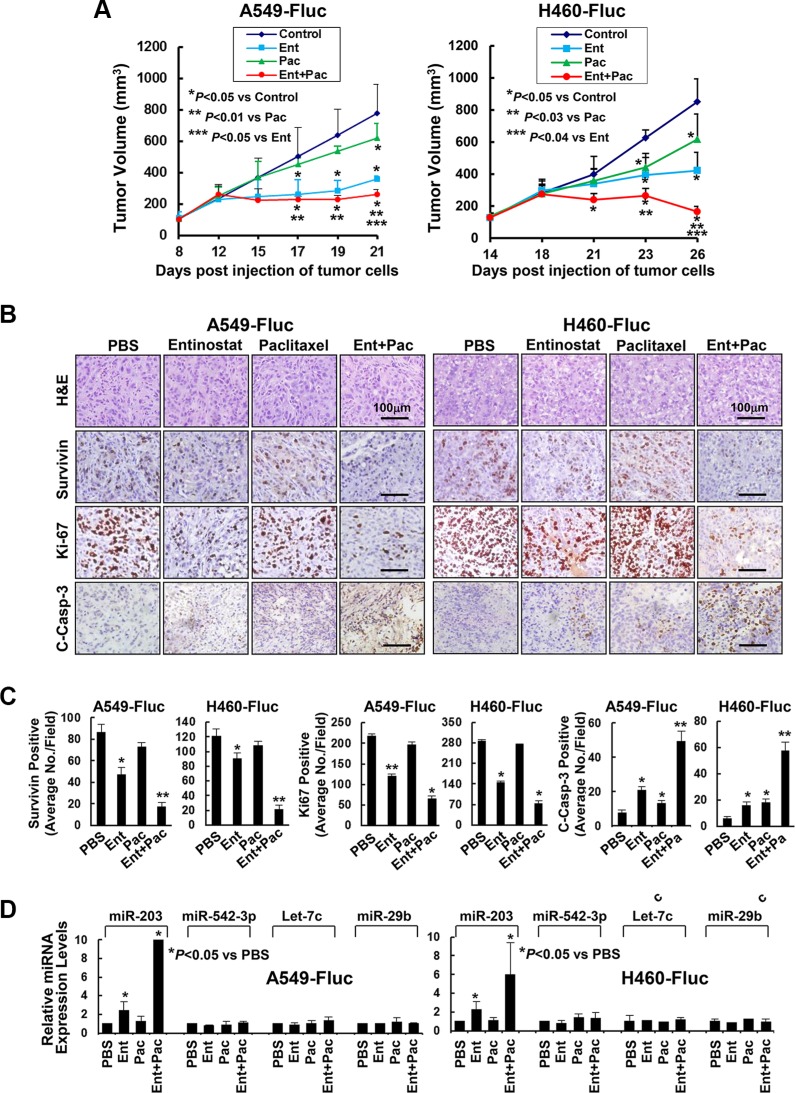
Figure 7. Entinostat in combination with paclitaxel significantly inhibits in vivo tumor growth of NSCLC cells.
A549-Fluc or H460-Fluc cells were subcutaneously inoculated into nude mice to establish tumor xenografts. The tumor-bearing mice received i.p. injections of either PBS, or entinostat (25 mg/kg for A549-Fluc, 12.5 mg/kg for H460-Fluc), or paclitaxel (7.5 mg/kg) alone, or both entinostat and paclitaxel as described in Methods. After five treatments, all mice were euthanized and their tumors were excised for histology, IHC, and miRNAs expression analyses. (A) The graphs show the tumor growth curves. Bars, S.D. (B) Data show the representative tumors with H&E staining and IHC analysis of Survivin, Ki-67, and cleaved caspase-3 (C-Casp-3). (C) The IHC slides were observed by two independent personnel. The tumor cells with positive staining of Survivin, Ki-67, or cleaved caspase-3 were counted from three randomly selected areas in each slide. The three areas were first identified by scanning the entire slide at × 100 magnification, and then the positive-stained cells were counted at × 200 magnification using an Olympus BX40 microscope. The bar graphs show the average of positive staining cells in each field. Bars, S.D. P values versus control were indicated. *P < 0.01, **P < 0.001. (D) Isolated tumors were immersed in RNA safer reagent and subjected to total RNA extraction, inclusive of the small RNA fraction. The expression levels of miR-203, miR-542-3p, Let-7c, and miR-29b were measured by qRT-PCR. All results were normalized with the internal control RNU6B. Bars, S.D. Data show the representative of three independent experiments.

