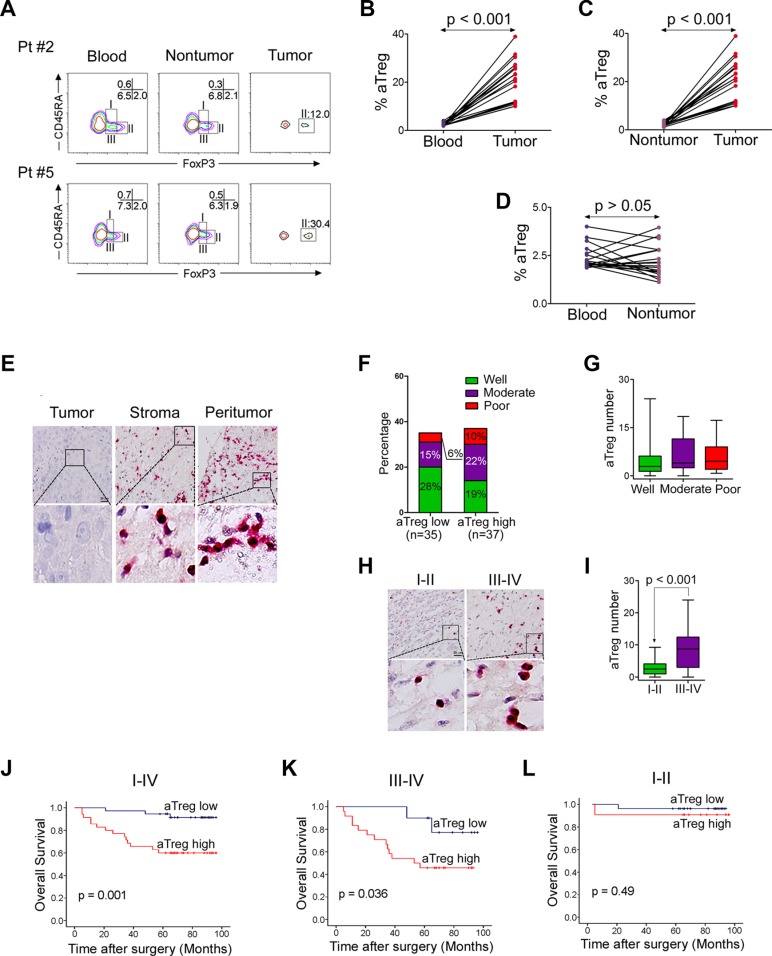
Figure 1. Phenotype and clinical implications of tumor-infiltrating Treg cells.
(A–D) Predominant infiltration of aTreg cells into HNSCC tissues. (A) CD4+ T cells from peripheral blood, adjacent nontumor sites, and tumor sites were fractionated into subpopulations based on the expression of CD45RA and FoxP3. The frequency of CD4+ T cells in each fraction was analyzed. Data from two representative patients are shown. (B–D) Comparison of the frequency of aTreg cells within peripheral blood, adjacent nontumor sites, and tumor sites (n = 19). (E) Immunohistochemistry of aTreg cells in LSCC samples (n = 72). Representative images showing staining of aTreg cells within the tumor, stroma, and peritumor sites are shown. Brown: FoxP3; Red: CD25. Scale bars: 30 μm. The lower panels are magnified images of the boxed area in the corresponding upper panel. (F) Comparison of the percentage of differentiation of tumors with low levels of aTreg cell infiltration compared to those with high levels. (G) Box plot showing quantitative evaluation of aTreg cell infiltration. Statistical differences between the three groups were analyzed using Kruskal-Wallis tests. (H–I) The level of aTreg cell infiltration in patients with early-stage tumors was lower than the level in patients with late-stage tumors. (H) Representative images showing staining of aTreg cells within tumor tissues from patients with early-stage (I and II) and late-stage (III and IV) tumors. (I) Statistical differences between the two groups were analyzed using Mann-Whitney U-tests. (J–L) Accumulation of tumor-infiltrating aTreg cells predicts poor survival in patients with LSCC. Kaplan-Meier curve for overall survival according to the number of tumor-infiltrating aTreg cells in 72 LSCC patients at (J) stages I–IV, (K) stages III and IV only, or (L) stages I and II only. Samples were divided into two groups based on the level of aTreg cell infiltration.

