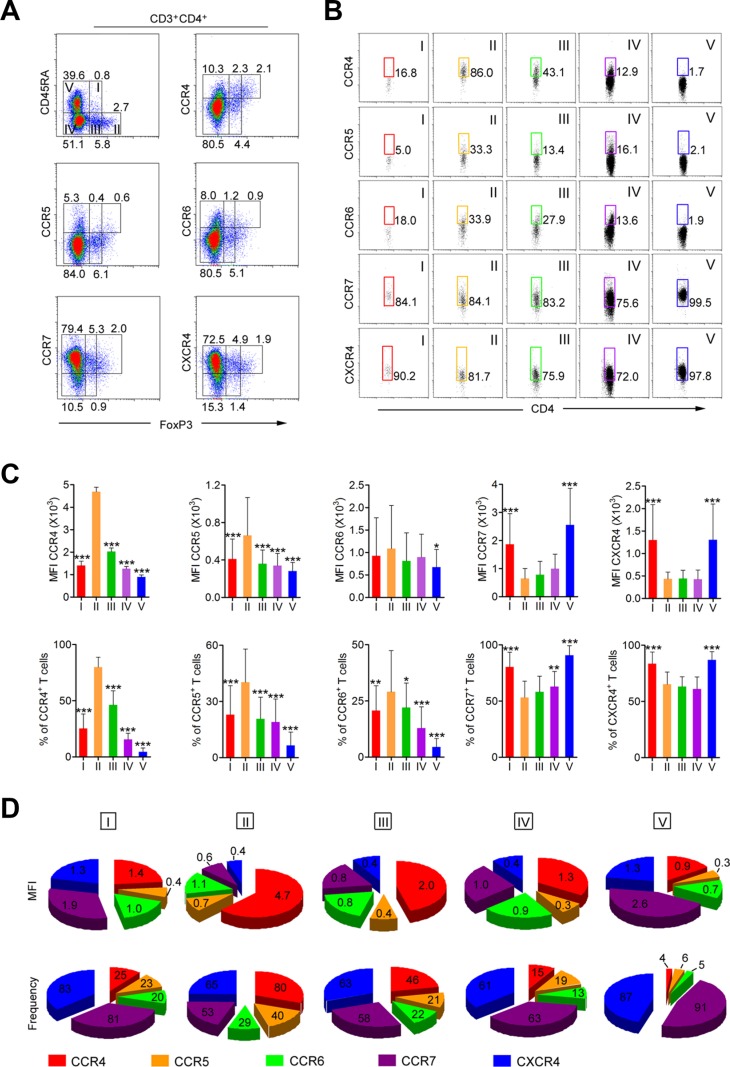
Figure 3. CCR4 is predominantly expressed on aTreg cells in HNSCC patients.
(A) CCR4, CCR5, CCR6, CCR7, and CXCR4 expression by subpopulation of FoxP3+ Treg cells in PBMCs from HNSCC patients. (B) The expression of CCR4, CCR5, CCR6, CCR7, and CXCR4 was evaluated in each fraction of CD4+ T cells. Representative data from 50 HNSCC patients are shown. (C) Mean fluorescence intensity (MFI, upper) and frequency (lower) of CCR4, CCR5, CCR6, CCR7, and CXCR4 expression by each fraction of CD4+ T cells in PBMCs from HNSCC patients (n = 50). Statistical differences were analyzed using Kruskal-Wallis tests. *P < 0.05, **P < 0.001, and ***P < 0.0001. (D) Summary of MFIs (mean, upper) and frequency (mean, lower) of CCR4, CCR5, CCR6, CCR7, and CXCR4 in each fraction of CD4+ T cells. I: FoxP3loCD45RA+CD4+ resting Treg cells; II: FoxP3hiCD45RA−CD4+ aTreg cells; III: cytokine-secreting FoxP3loCD45RA−CD4+ non-Treg cells; IV: FoxP3−CD45RA−CD4+ T cells; V: FoxP3−CD45RA+CD4+ T cells.

