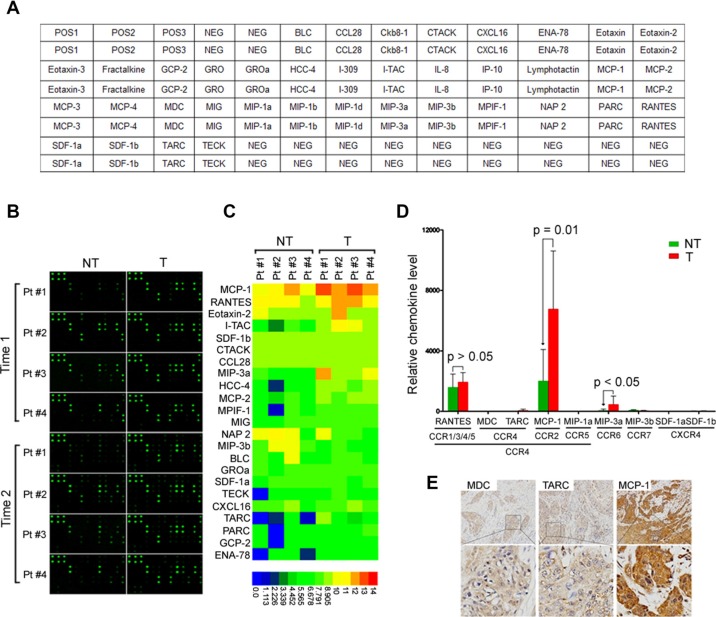
Figure 4. MCP-1 is increased in tumor tissues from HNSCC patients.
(A) Map of antibodies against chemokines on the RayBiotech Human Chemokine Antibody Array (AAH-CHE-G1). (B) Cell lysates from tumor and adjacent nontumor tissues were first applied to the array. Bound chemokines were then recognized by a pool of anti-chemokine antibodies corresponding to the antibodies spotted on the array. Similar results were observed in two independent arrays. (C) Semiquantification of scanned antibody arrays. The levels were normalized to internal positive controls present in each membrane. Semiquantitative levels are represented in the heat map. (D) Expression of CCR4, CCR5, CCR6, CCR7, CXCR4 ligands in tumor and adjacent nontumor tissues. Statistical differences were analyzed using Mann-Whitney U-tests. (E) Representative staining of HNSCC cases for MDC, TARC, and MCP-1 (n = 15). Brown: positive staining × 100. Lower panels are magnified images of the boxed area in the corresponding upper panel. NT: nontumor; T: tumor.

