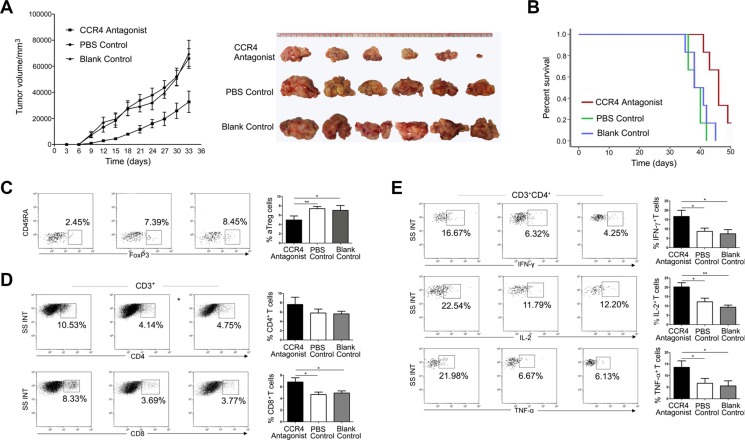
Figure 6. A CCR4 antagonist blocks aTreg cell trafficking in tumors leading to enhanced antitumor immune responses and prolonged survival.
(A) Tumor sizes were measured every 3 days after tumor cell injection (left panel). Tumors isolated 33 days after injection are shown in the right panel. Data are presented as the mean ± SD. P < 0.05 for the PBS or blank control groups versus the CCR4 antagonist-treated group. (B) Survival depicted as the percentage of surviving mice on the indicated day after tumor cell injection. Statistical comparisons were performed using the Kaplan-Meier test. P < 0.05 for the PBS or blank control groups versus the CCR4 antagonist-treated group. Frequencies of (C) aTreg cells, (D) CD4+, CD8+T cells, and E. CD4+ T cells that secreted IFN-γ, IL-2, and TNF-α. Histograms show the frequencies of each T cell subset. Statistical comparisons were performed using one-way ANOVA. *P < 0.05 and **P < 0.01.

