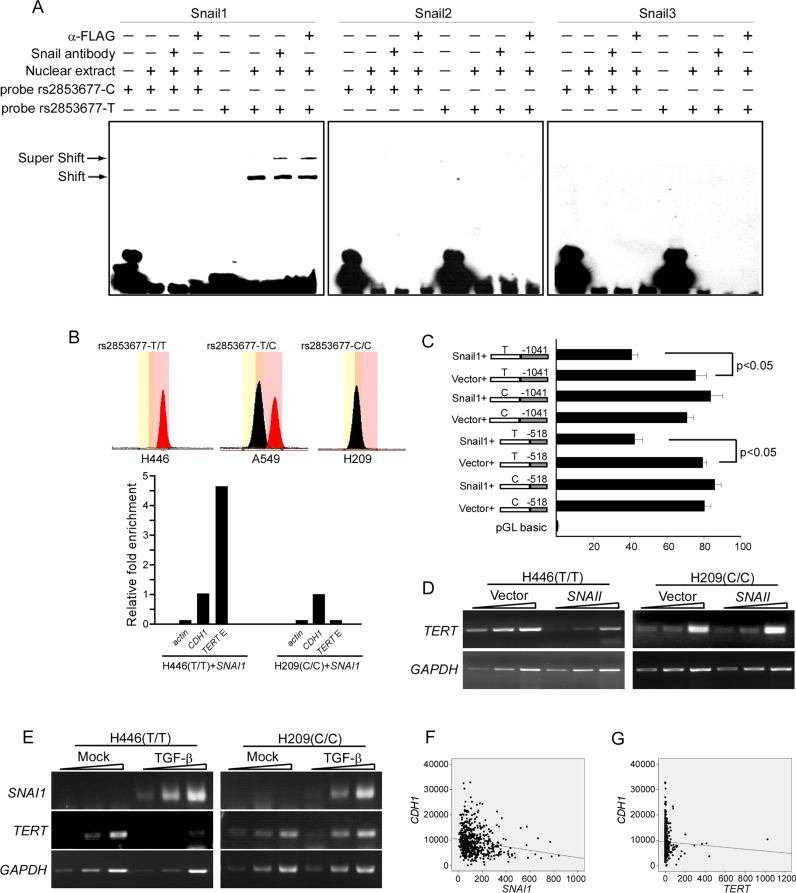
Figure 2. Rs2853677 affects TERT transcriptional regulation by Snail1.
(A) EMSA shows mobility super shift (S.S.) of DNA fragment containing rs2853677. SNAI1-FLAG or SNAI2-FLAG or SNAI3-FLAG were overexpressed in H446 cells. Oligos carrying T or C allele were labeled with biotin in its 3′ terminus and incubated with nuclear extract that was purified from H446 expressing Snail1/2/3-FLAG. The antibody against Snail1/2/3 or FLAG was added to confirm the binding of Snail proteins to the oligos. Oligos harboring T allele but not the C allele can be bound by Snail1. (B) ChIP shows the occupancy of Snail1 in the TERT intronic enhancer in vivo. SNAI1-FLAG was overexpressed in H446 or H209 cells. ChIP was performed with FLAG antibody. Enrichment fold was evaluated by real-time PCR. Upper panels showed genotype of rs2853677 in H446 and H209 cells. Lower panels showed relative fold enrichment of Snail1 in the TERT intronic enhancer. CDH1 promoter was used as a positive control and its enrichment was set to 1.0. Actin was used as a negative control. Association of Snail1-Flag with the TERT intronic enhancer was shown. (C) Luciferase reporter study shows effect of Snail1 cotransfection on the TERT intronic enhancer activity. Snail1 or empty vector was cotransfected with the enhancer-TERT promoter constructs into HEK293 cells. Luciferase activity was measured after 24 hrs' transfection. Mean ± SD indicate three independent transfections. (D) Semiquantitative RT-PCR was performed to measure TERT transcription in control or Snail1 expressing cells. 1 ul, 3 ul, 9 ul of reverse transcribed cDNA was analyzed by PCR. (E) Semiquantitative RT-PCR was performed to measure TERT and SNAI1 transcription in control or TGF-β treated cells. 1 ul, 3u l, 9 ul of reverse transcribed cDNA was analyzed by PCR. (F) Expression of Snail1 and E-cadherin was assessed for correlation in lung adenocarcinoma using TCGA databases. SNAI1 negatively correlated with CDH1 (r = − 0.169, p = 4.545 × 10⁻⁵). (G) Expression of TERT and E-cadherin was assessed for correlation in lung adenocarcinoma using TCGA databases. TERT did not correlate with CDH1 (r = − 0.041, p = 0.321).

