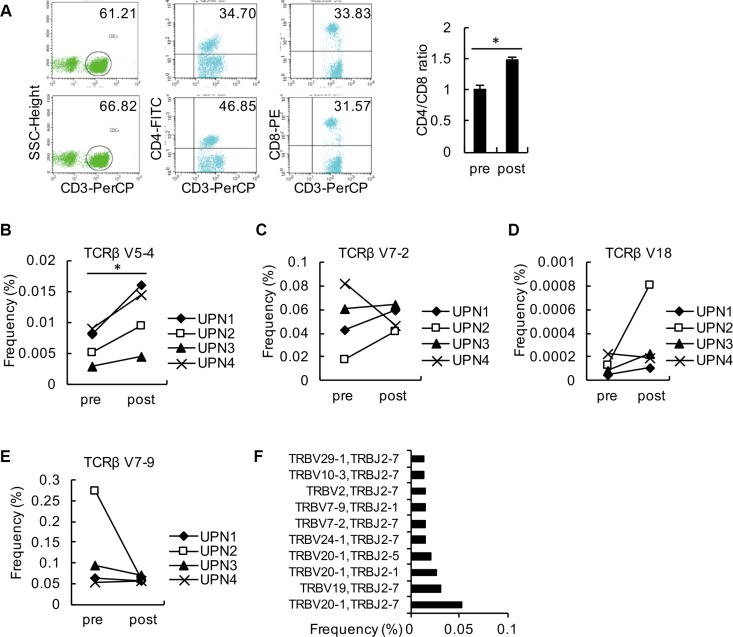
Figure 4. Analysis of changes in relative TCRβ V and TCRβ J.
(A) PBMCs from the 4 patients were collected as detected by flow cytometry using antibodies against CD3, CD4, and CD8. The average ratios of CD3+CD4+: CD3+CD8+ from these patients are shown. (B–E) The frequencies of TCRβ V5-4 (B), TCRβ V7-2 (C), TCRβ V18 (D) and TCRβ V7-9 (E) in PBMCs from each patient before and after decitabine therapy are shown. (F) The top 10 V-J combinations in PBMCs from the 4 patients following decitabine therapy are listed.

