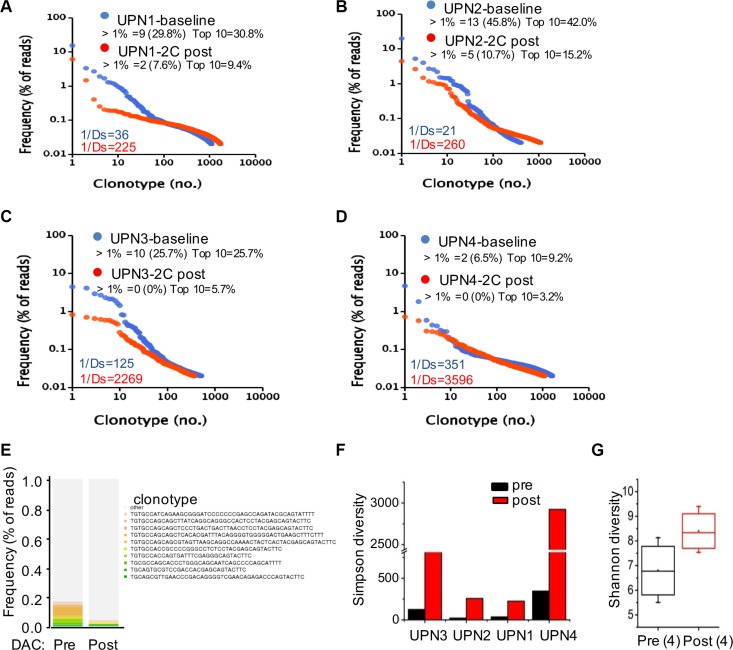
Figure 5. Low-dose decitabine increased TCR diversity in PBMCs.
(A–D) Frequency distribution of clonotypes in plots of UPN1 (A), UPN2 (B), UPN3 (C), and UPN4 (D) at baseline (in blue) and after 2 cycles of decitabine therapy (in red). Each dot represents a distinct TCRβ clonotype. Clonotypes are presented at frequencies > 1% and the top 10 clonotypes with their cumulative frequency (percentage of reads). Values in the lower-left corner depict TCR diversity. (E) The 10 most frequent clonotypes in the 4 patients at baseline (pre) and after 2 cycles of decitabine therapy (post) are indicated in color and listed at the right; the remaining clonotypes are grouped in black. (F) TCR Simpson diversity of the 4 patients after 2 cycles of decitabine therapy compared to that of the baseline. (G) The average T cell repertoire Shannon diversity of the 4 patients before and after decitabine therapy.

