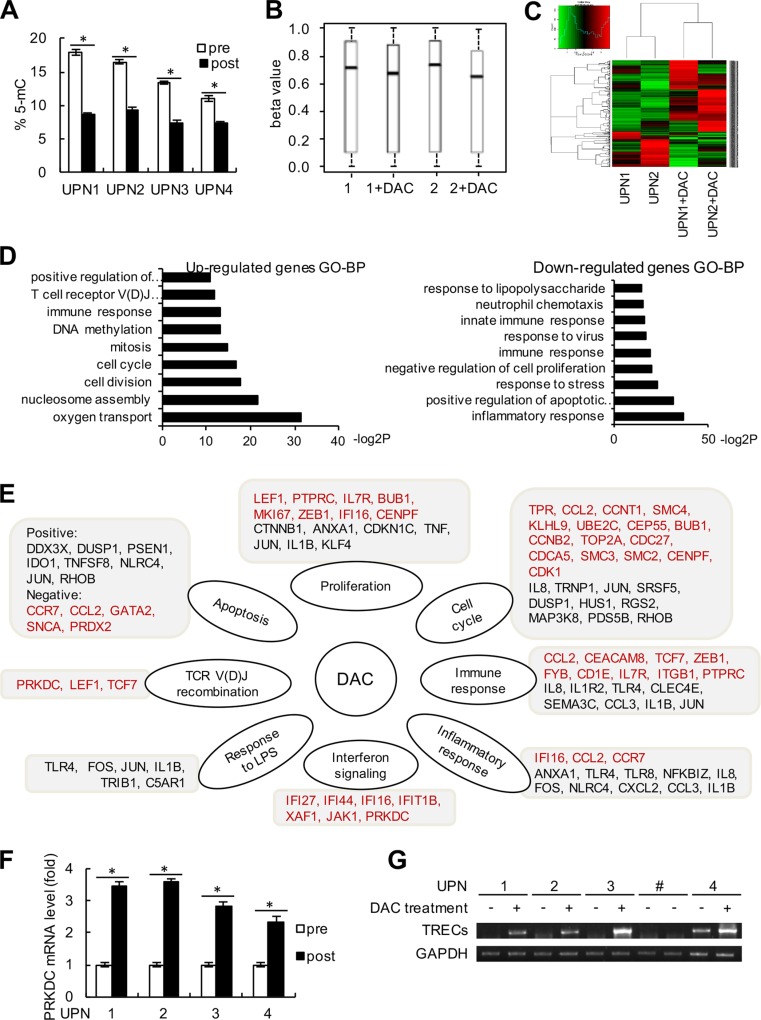
Figure 6. Genome-wide expression alteration and PRKDC induction.
(A) The peripheral T cells were sorted by flow cytometry using anti-CD3 antibody from blood samples in these 4 patients (UPN1 to UPN4). The percentages of 5-mC in T cells from the 4 patients before and after decitabine therapy were detected relative to the total cytosine content. (B) Beta value changes in CpG islands in patients UPN1 and UPN2 before and after decitabine therapy. (C) Heat map and sample clustering analysis of the differentially expressed genes before and after decitabine therapy in the same patients as (B). (D) Significantly enriched up-regulated and down-regulated GO terms in biological process (BP) clusters were analyzed. The data shown are the negative log2 P-values within each category. (E) Central pathways and differentially expressed genes are shown according to the chip data. Genes in red type indicate the up-regulated genes, and genes in black type indicate the down-regulated genes. (F) The relative mRNA expression level of PRKDC was detected by quantitative RT-PCR assay. (G) TRECs and GAPDH expression levels were detected in the 4 patients before and after decitabine therapy as described in the “Method” section. UPN# (line 7 and 8) was shown as negative control, who was not received the DAC treatment.

