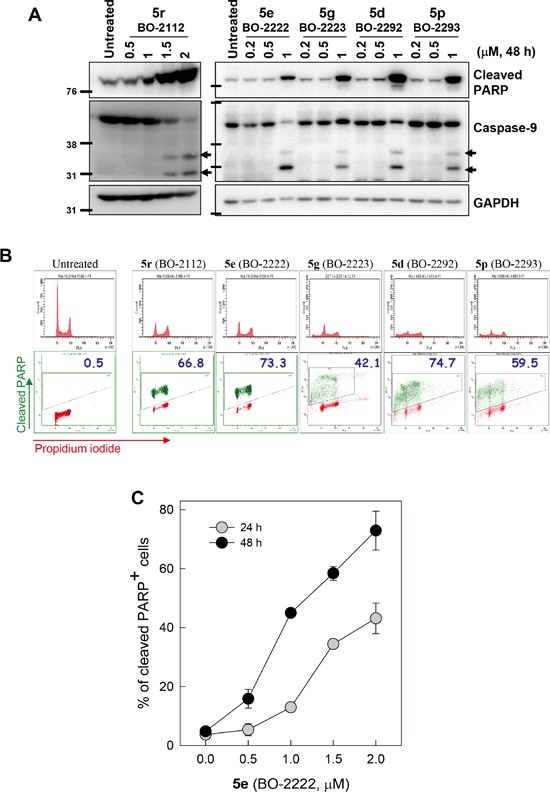
Figure 3. Induction of apoptosis by treatment with CiQ derivatives.

A. A549 cells were treated with the indicated CiQ derivative for 48 h and then subjected to immunoblotting to detect cleavage of PARP (cPARP) and caspase-9. B. Cell cycle distribution of cPARP-positive cells. A549 cells were treated with the indicated CiQ derivative for 48 h, and then subjected to flow cytometric analysis of PARP cleavage. Cellular DNA was counterstained with propidium iodide. In the lower panel, the green dots indicate cleaved PARP-positive cells and the numbers indicate the percentage of cleaved PARP-positive cells. C. A549 cells were treated with 5e (BO-2222) for 24 or 48 h, and PARP cleavage was subsequently analyzed by flow cytometry. The percentages of cells with cleaved PARP were determined. The data represent the mean ± SD for three independent experiments.
