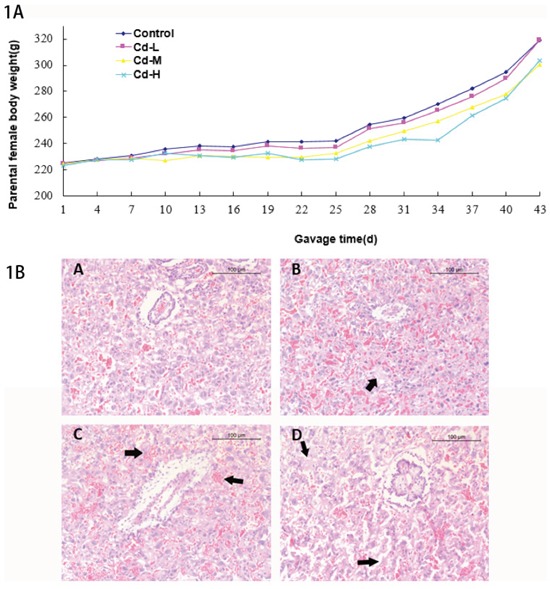
Figure 1.

A. Body weights of parental females. B. The histological analysis of placentas in different treatment groups. (A): control group. B: Cd-L group. Mild degradation of cytotrophoblastic cells was seen (arrow). C: Cd-M group. Placental hyperemia and decreased glycogen cells were observed (arrow). D: Cd-H group. Dramatic degradation of cytotrophoblastic cells was seen (arrow).
