
Figure 2. Growth rate, angiogenesis, permeability, and blood perfusion of EO771 mouse mammary tumors.
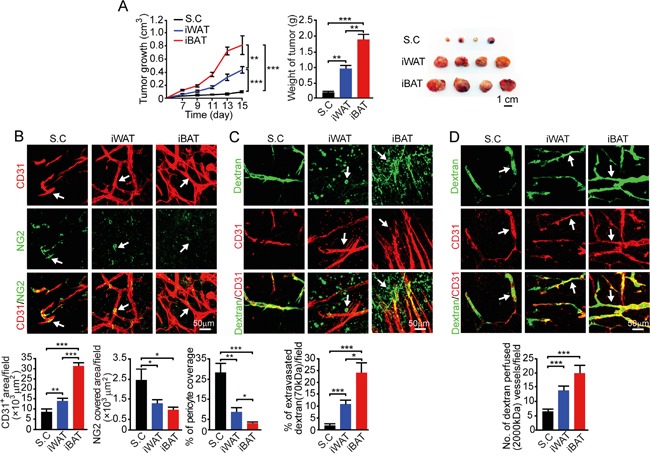
A. Approximately 0.5 × 10⁶ tumor cells were implanted in subcutaneous region of the dorsal back, iWAT and iBAT of each adult mouse. Tumor growth rates were measured as volume and weighed (n = 8 mice/group). Representative tumors are shown. B. CD31+ microvessel density and morphology, NG2+ pericytes associated area and % NG2+ pericyte coverage microvessel of tumors implanted in subcutaneous tissue, iWAT and iBAT. Arrows indicate tumor microvessel, pericytes, and pericyte coverage in their corresponding panels. Bar = 50 μm. Quantification of CD31+ microvessel density, NG2+ pericytes associated area, and % of NG2+ pericyte coverage (n = 8 random fields/group). C. Extravasation of rhodamine-labeled 70-kDa dextran in subcutaneous, iWAT and iBAT implanted tumors. Arrows point to the extravasated dextran signals. Bar = 50 μm. Quantification of the extravasated dextran positive signals (n = 6 random fields/group). D. Blood perfusion of 2000-kDa dextran in subcutaneous, iWAT and iBAT implanted tumors. Arrows point to the dextran-perfused vessels. Bar = 50 μm. Quantification of the dextran-perfused positive signals (n = 6 random fields/group). *p<0.05; **p<0.01; ***p<0.001. Data were presented as mean determinants ± S.E.M.