
Figure 3. Microvessel, inflammation, and tissue hypoxia of EO771 mouse mammary tumors implanted in subcutaneous, iWAT and iBAT tissues.
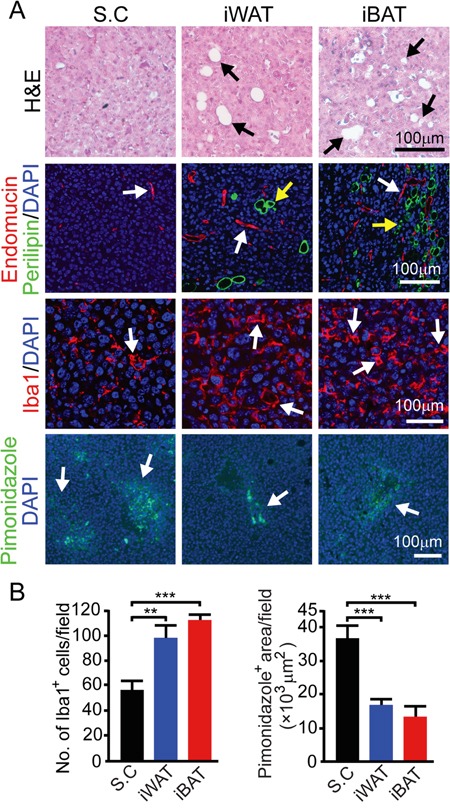
A. Representative micrographs of H&E, endomucin plus perilipin, Iba1, and pimonidazole staining. Arrows point to adipocytes, microvessel, Iba1 and pimonidazole positive signals. Bar = 100 μm. B. Quantification of number of Iba1+ (n = 8 random fields/group), and pimonidazole+ signals (n = 6 random fields/group). **p<0.01; ***p<0.001. Data were presented as mean determinants ± S.E.M.