
Figure 4. Growth rate, angiogenesis, microvessel, inflammation and tissue hypoxia of B16-F10 mouse melanoma tumors implanted in subcutaneous, iWAT and iBAT tissues.
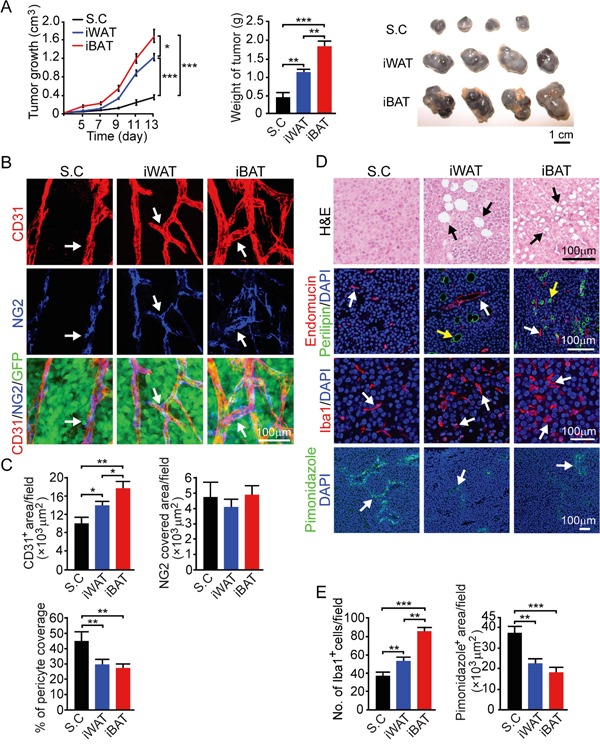
A. Approximately 0.5 × 10⁶ tumor cells were implanted in subcutaneous region of the dorsal back, iWAT and iBAT of each adult mouse. Tumor growth rates were measured as volume and weighed (n = 8 mice/group). Representative tumors are shown. B. CD31+ microvessel density and morphology, NG2+ pericytes associated area and % NG2+ pericyte coverage microvessel of tumors implanted in subcutaneous tissue, iWAT and iBAT. Arrows indicate tumor microvessel, pericytes, and pericyte coverage in their corresponding panels. Bar = 100 μm. C. Quantification of CD31+ microvessel density, NG2+ pericytes associated area, and % of NG2+ pericyte coverage (n = 8 random fields/group). D. Representative micrographs of H&E, endomucin plus perilipin, Iba1, and pimonidazole staining. Arrows point to adipocytes, microvessel, Iba1 and pimonidazole positive signals. Bar = 100 μm. E. Quantification of number of Iba1+ (n = 8 random fields/group), and pimonidazole+ signals (n = 6 random fields/group). *p<0.05; **p<0.01; ***p<0.001. Data were presented as mean determinants ± S.E.M.