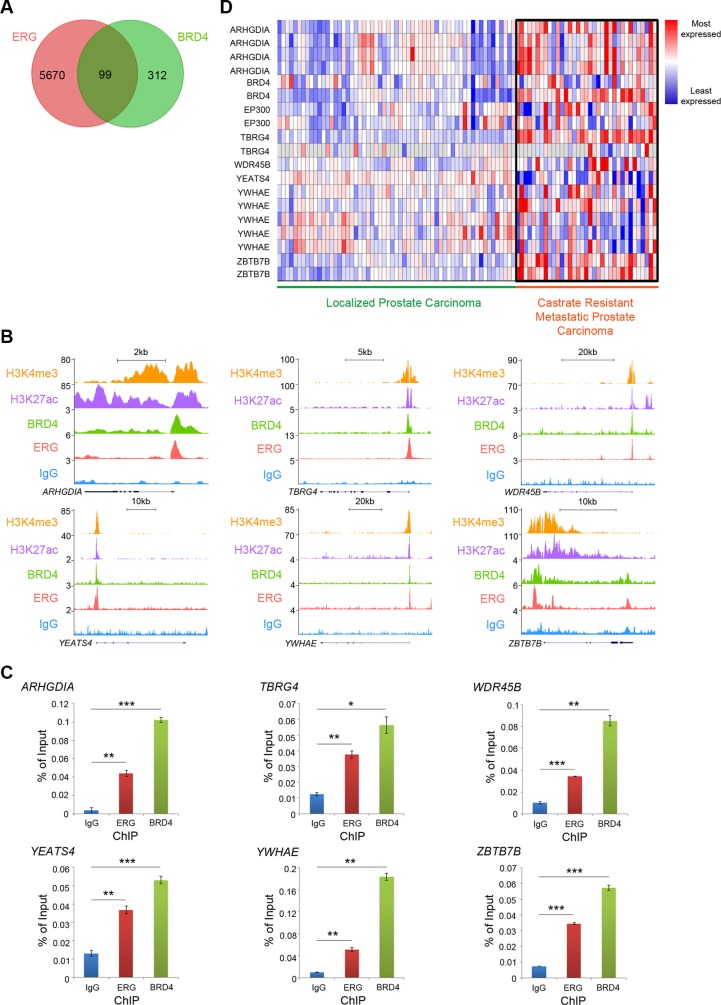
Figure 4. Endogenous ERG and BRD4 occupy the same subset of chromatin loci in VCaP PCa cells.
(A) Venn diagram showing the number of ERG or BRD4 ChIP-seq peaks at gene promoters and the number that overlapped. Overlapped binding sites were analyzed by the permutation test with P < 0.0001. VCaP ChIP-seq data for ERG and BRD4 were downloaded from NCBI Gene Expression Omnibus [10] with accession number GSE55064 [11]. (B) Previously published, publicly accessible ChIP-seq data from VCaP cells for BRD4 and ERG (T1-E4) IP, with IgG IP as a control. Six representative genes are shown. H3K4me3 and H3K27ac ChIP-seq data from LNCaP PCa cells shown to provide basic information about regions of gene promoter and active transcription. VCaP ChIP-seq data for ERG, BRD4, and IgG were downloaded from NCBI Gene Expression Omnibus [10] with accession number GSE55064 [11]. Signature profiles for H3K4me3 and H3K27ac in LNCaP cells were downloaded with accession numbers GSE43791 for H3K4me3 and GSE27823 for H3K27ac [26]. (C) ChIP-qPCR with ERG (T1–E4), BRD4, and IgG IP for each of the six genes to validate ERG and BRD4 binding in VCaP cells. *P < 0.05, **P < 0.01, ***P < 0.001. (D) Gene expression heat map from the Grasso PCa patient dataset [27], comparing expression of genes from 59 localized and 35 CRPC patient samples. Compiled with the ONCOMINE cancer microarray database [54].

