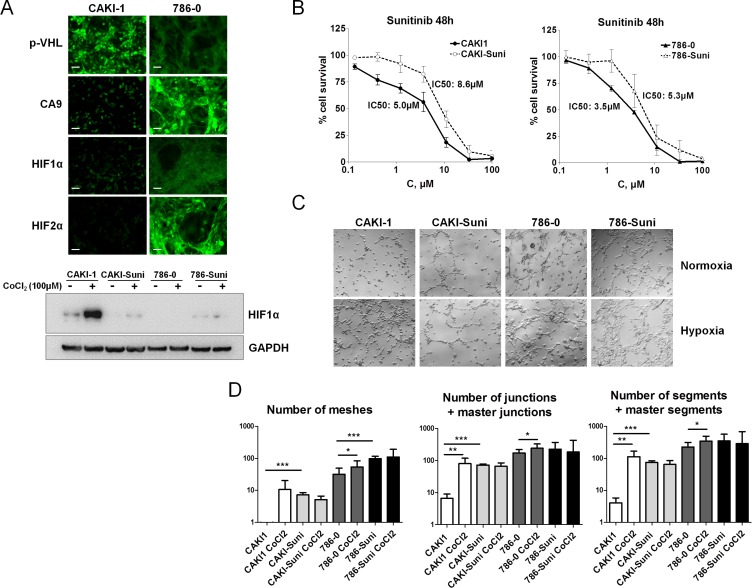
Figure 2. In vitro characterisation of acquired resistance to sunitinib in RCC cells.
(A) Expression of p-VHL, CA9, HIF1α and HIF2α by immunofluorescence in CAKI-1 and 786–0 cells under normoxia or hypoxia induced by 24 h exposure to 100 μM CoCl2. Representative pictures of three independent experiments. Bars, 100 μm. (B) Forty-eight hours sunitinib cytotoxicity in CAKI1, CAKI- Suni, 786–0 and 786-Suni models. (C) Pseudo-tubes formation by CAKI-1, CAKI-Suni, 786–0 and 786-Suni tumor cells on Matrigel after 24 h cell incubation in normoxia and hypoxia induced by 100 μM CoCl2. (D) Quantification of the tubes formation parameters by « Angiogenesis Analyzer » from Image J software. Data are pooled from three independent experiments. Bar indicate the mean ± SEM. P-values were calculated using unpaired Student's t tests: *P < 0.05, **P < 0.01, ***P < 0.001.

