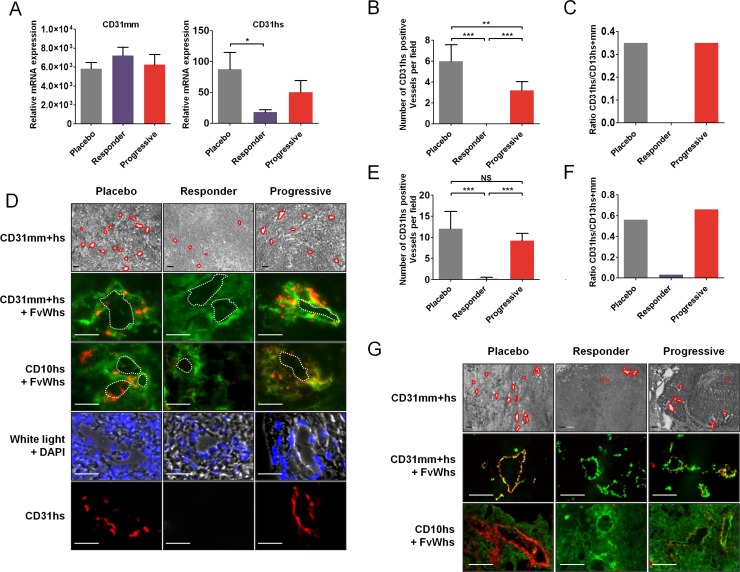
Figure 3. Tumor cells expressing endothelial cells markers in sunitinib first-line RCC xenografts.
(A) Quantification of CD31mm and CD31hs mRNA expression in placebo and sunitinib-treated tumors. Data are pooled from 6–8 animals per group. Bars indicate the mean ± SD. (B) Number of CD31hs-stained vessels per field from CAKI-1 xenografted tumors. Data are pooled from 6–8 animals per group. Bars indicate the mean ± SEM (C) Proportion of CD31hs positive vessels among CD31 positive vessels in CAKI- 1 xenografted tumors. Data are pooled from 6–8 animals per group. Bars indicate the ratio of the mean values. (D) Bright field and immunofluorescence examination of CD31 (CD31mm+hs), human CD31 (CD31hs), human FvW (FvWhs), and human CD10 (CD10hs) expression in placebo and sunitinib-treated tumors from CAKI-1 xenografts. Red lines indicate vascular lumens. Images are representative of 6–8 analysed mice. Bars, 100 μm. (E) Number of CD31hs-stained vessels per field from 786–0 xenografted tumors. Data are pooled from 6–8 animals per group. Bars indicate the mean ± SEM (F) Proportion of CD31hs positive vessels among CD31 positive vessels in CAKI- 1 xenografted tumors. Data are pooled from 6–8 animals per group. Bars indicate the ratio of the mean values. (G) Immunofluorescence analysis of CD31 (CD31mm+hs), human CD31 (CD31hs), human FvW (FvWhs), and human CD10 (CD10hs) expression in placebo and sunitinib-treated tumors from 786–0 xenografts. Images are representative of 6–8 analysed mice. Bars indicate the mean ± SEM. P-values were calculated using unpaired Student's t tests: *P < 0.05, **P < 0.01, ***P < 0.001, NS, P ≤ 0.05.

