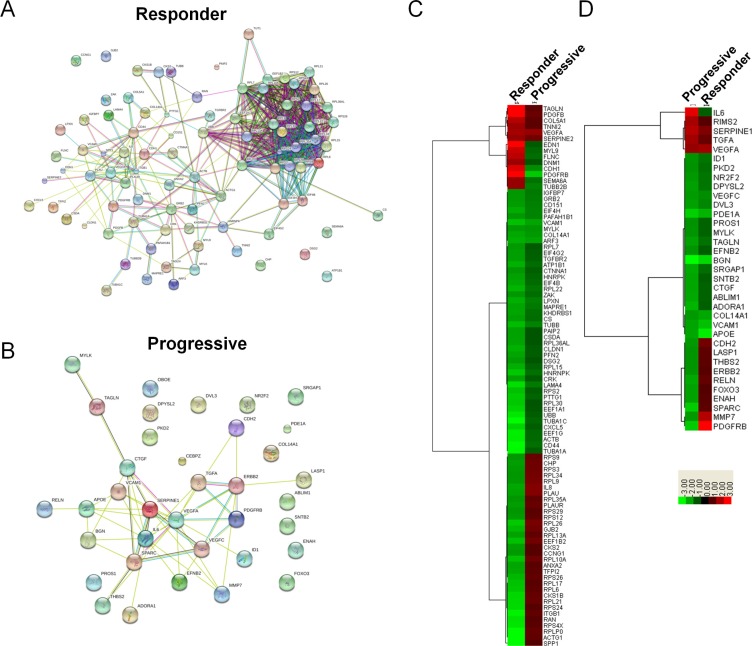
Figure 5. Expression analysis of differentially expressed genes identified in Metacore's top 10 process network maps for sunitinib progressive and responsive tumors.
(A and B) Functional Interaction Map for differentially expressed genes identified in Metacore's top 10 process network maps for sunitinib responsive (A) and progressive (B) tumors. All differentially expressed genes identified in Metacore's top 10 process network maps for sunitinib progressive tumors were input into the STRING functional interaction database. Lines between genes depict known functional interactions. (C and D) Hierarchical clustering of gene expression fold changes for the 90 genes and 35 genes identified in Metacore's top 10 process network maps for sunitinib responsive (C) and progressive (D) tumors.

