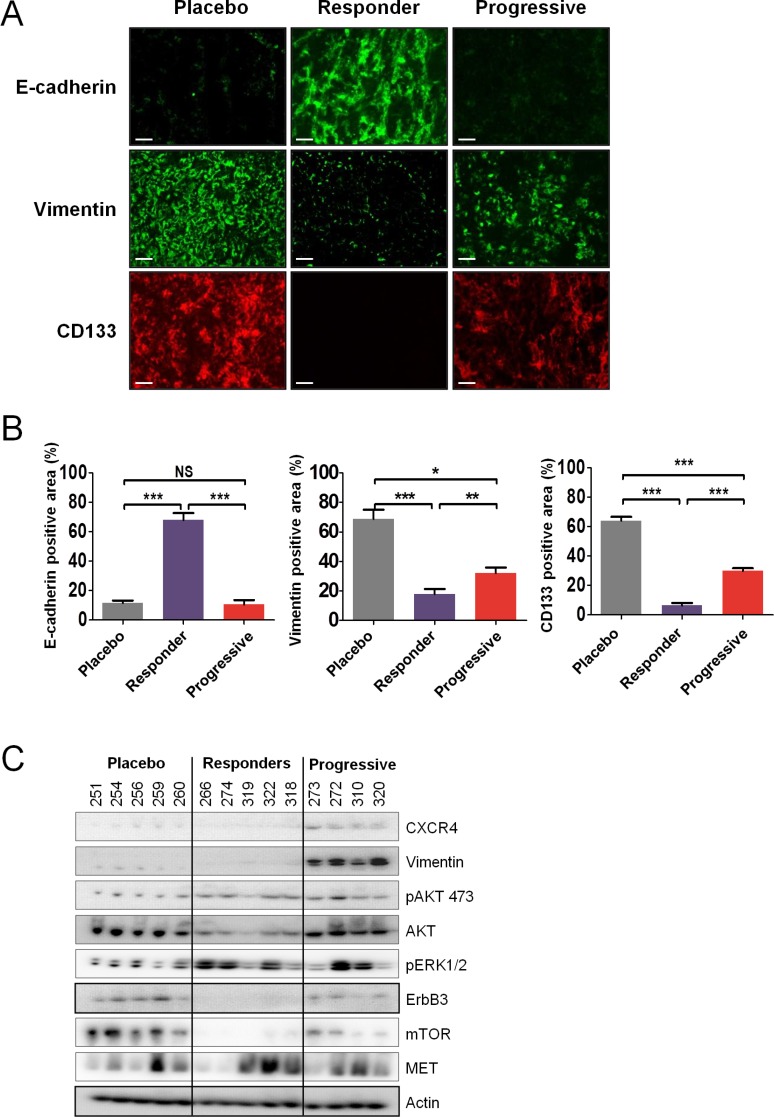
Figure 6. Sunitinib resistance is associated with tumor differentiation.
(A and B) Immunofluorescence examination (A) and quantitative analysis (B) of CD133, vimentin, and E-cadherin expression in placebo and sunitinib-treated tumors. Data are pooled from 6–8 animals per group. Bars indicate the mean ± SEM. P-values were calculated using unpaired Student's t tests: *P < 0.05, **P < 0.01, ***P < 0.001, NS, P ≤ 0.05. (C) Protein expression by western blot of selected genes in sunitinib-treated tumors. Representative expression of 4–5 mice per group.

