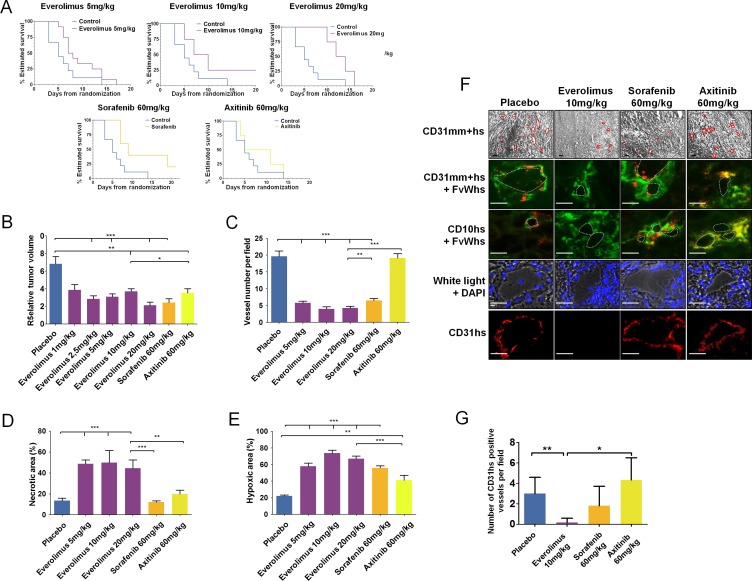
Figure 7. Everolimus effects on in vivo sunitinib-resistant tumors.
(A) Time to progression (TTP) of mice treated with everolimus (5, 10, and 20 mg/kg), sorafenib (60 mg/kg), or axitinib (60 mg/kg) using Kaplan Meier estimate from 56 mice TTP data. (B) Relative tumor volume at the end of second-line treatment with everolimus (1, 2.5, 5, 10, and 20 mg/kg), sorafenib (60 mg/kg), or axitinib (60 mg/kg) according to T0. Data are pooled from 4–12 animals per group. Bars indicate the mean ± SEM. (C-E) Vessel numbers per field (C), percentage of necrotic area (D) and hypoxic area (E) in sunitinib-resistant CAKI-1 tumors from mice treated with everolimus, sorafenib, or axitinib. Bars indicate the mean ± SEM. P-values were calculated using unpaired Student's t tests: *P < 0.05, **P < 0.01, ***P < 0.001. (F) Bright field and immunofluorescence examination of CD31 (CD31mm+hs), human CD31 (CD31hs), human FvW (FvWhs), and human CD10 (CD10hs) expression in tumors after second-line treatment with everolimus (10 mg/kg), sorafenib (60 mg/kg) or axitinib, (60 mg/kg). Red lines indicate vascular lumens. Bars, 100 μm. (G) Number of CD31hs stained vessels per field. Bars indicate the mean ± SEM of 10 high magnification fields. P-values were calculated using unpaired Student's t tests: *P < 0.05, **P < 0.01.

