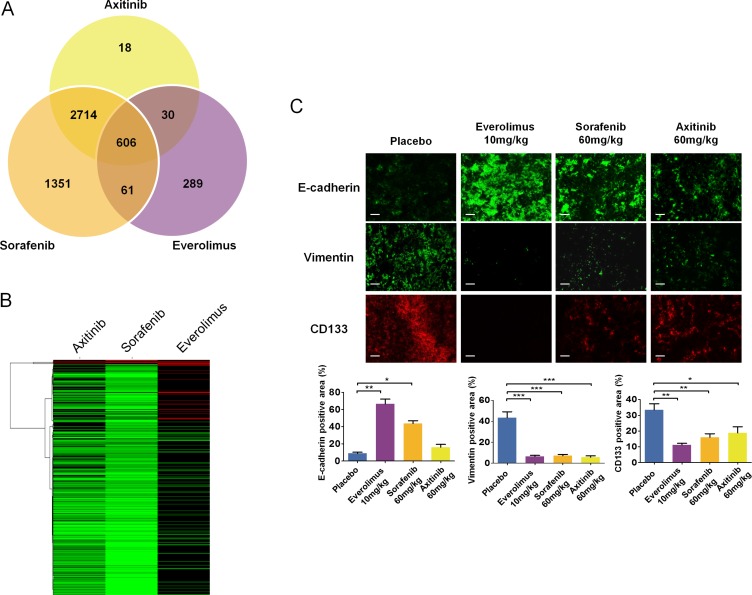
Figure 8. Molecular changes and tumor differentiation induced by second line treatment with everolimus, sorafenib and axitinib in sunitinib-resistant tumors.
(A) Identification of differentially regulated expression profiles in the second line treatments. All 1.75 fold or greater (p < 0.05) gene expression changes between the second line placebo and sorafenib, axitinib, or everolimus were input into a genomics Venn calculator to identify genes whose expression profiles were shared or unique between the three second line treatments relative to the placebo. (B) Hierarchical clustering of gene expression fold changes for the 372, 497, and 82 genes in the axitinib, sorafenib, and everolimus treatments, respectively. (C) Immunofluorescence examination and quantitative analysis of CD133, vimentin, and E-cadherin expression in tumors after second-line treatment with everolimus, axitinib, or sorafenib. Bars, 100 μm. Data are pooled from 4 animals per group. Bars indicate the mean ± SEM. P-values were calculated using unpaired Student's t tests: *P < 0.05, **P < 0.01, ***P < 0.001.

