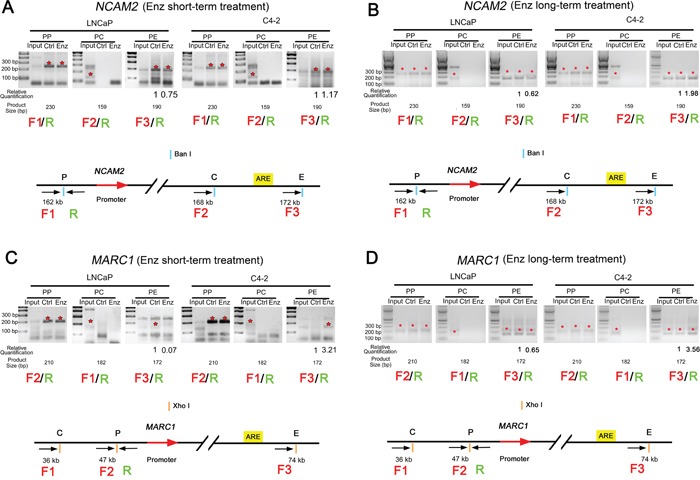
Figure 5. Enzalutamide treatment enhances enhancer-promoter interaction in the loci of NCAM2 and MARC1 in C4-2 cells.

The enhancer-promoter looping in the indicated gene loci was measured by 3C assay. The expected PCR amplicons of DNA obtained from 3C assay at the loci of NCAM2 and MARC1 are 190 and 172 bp, respectively. A and B. 3C assays in the NCAM2 locus in both LNCaP and C4-2 cells treated with DMSO or enzalutamide (10 μM) for 48 h (A) or 28 days (B). C and D. 3C assays in the MARC1 locus in LNCaP and C4-2 cells treated with DMSO or enzalutamide (10 μM) for 48 h (C) or 28 days (D). PP: crosslinking at promoter alone; PC: crosslinking between promoter and control (middle) sites; PE: crosslinking between promoter and enhancer. LNCaP Ctrl: LNCaP cells treated with DMSO; LNCaP Enz: LNCaP cells treated with enzalutamide; C4-2 Ctrl: C4-2 cells treated with DMSO; C4-2 Enz: C4-2 cells treated with enzalutamide. Asterisks in red: PCR products are at the expected size.
