
Figure 1.
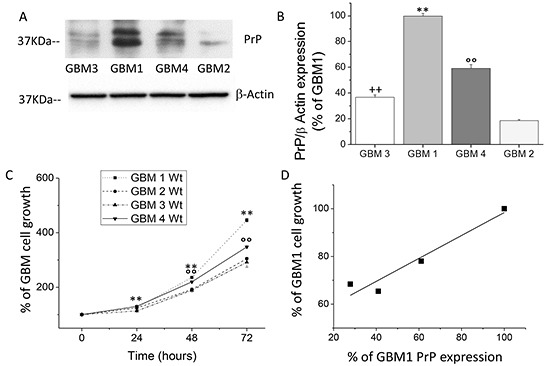
A. Representative immunoblot analysis of PrPC protein level in 4 different wt GBM CSC cultures. PrPC content was determined by 3F4 immunoreactivity. Immunoblotting for β-actin was used to normalize the results for the total content of proteins. B. Quantification of PrPC protein level, reported as densitometric analysis of blots as in panel A, derived from three independent experiments and expressed as percentage of wt GBM2, 3, 4 immunoreactive bands vs. wt GBM1. **p < 0.01 vs. wt GBM2, 3, 4 CSCs, °°p < 0.01 vs. wt GBM 1, 2, 3 wt CSCs; ++p < 0.01 vs. wt GBM 1, 2, 4 CSCs. C. Growth curve of wt GBM 1-4 CSC cultures. Cell proliferation was evaluated by MTT reduction test. Values, taken as percentage of the values at time 0, are the average of two independent experiments, performed in quadruplicate. **p < 0.01 vs. GBM2,3,4, wt cells and °°p < 0.01 vs. GBM1,2,3 wt cells D. Linear regression analysis of the relationship between PrPC expression and the proliferation rate of GBM1-4 CSC cultures.