
Figure 3.
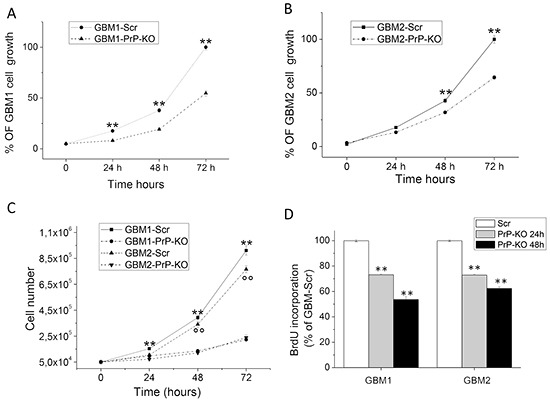
A-B. Proliferation curves of GBM1-PrP-KO and GBM1-Scr (A) and GBM2-PrP-KO and GBM2-Scr (B) cells assessed by MTT assay after 24, 48 and 72 hours. Each point represents the average of three experiments performed in quadruplicate. **p < 0.01 vs. respective GBM-PrP-KO cells. C. Proliferation curves of GBM1-PrP-KO, GBM1-Scr, GBM2-PrP-KO and GBM2-Scr cells assessed by cell count after 24, 48 and 72 hours of proliferation. Each point represents the average of three experiments performed in quadruplicate. **p < 0.01 vs. GBM1-PrP-KO. °°p < 0.01 vs. GBM2-PrP-KO. D. DNA synthesis rate of GBM1-PrP-KO and GBM2-PrP-KO cells in comparison with respective GBM-Scr control cells, determined by BrdU incorporation assay after 24 and 48 hours. Data are expressed as a percentage of respective GBM-Scr cells, and each point represents the average of three experiments, performed in quadruplicate. **p < 0.01 vs. respective GBM-Scr cells.