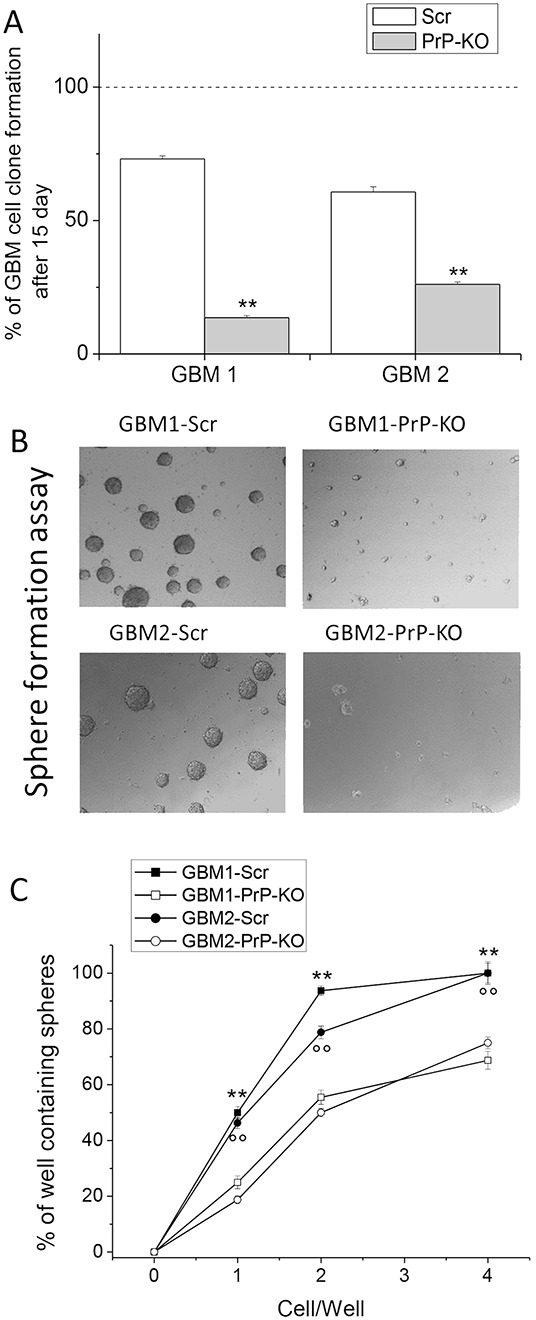
Figure 4.

A. Quantification of clonogenic activity of GBM1- and GBM2- Scr and PrP-KO cells, expressed as percentage of the number of plated cells, assumed as 100%. Each point represents the average of three experiments performed in quadruplicate. **p < 0.01 vs. GBM-Scr cells. B. Representative micrographs of the sphere formed by GBM-Scr and GBM-PrP-KO cells after 7 days of growth (using 5x/012 Leica Objective). These data underline that PrP-KO cells derived from both GBM1 and GBM2 form rare small spheroids. C. Limiting dilution analysis comparing stem cell of sphere formation between by GBM-Scr and GBM-PrP-KO cells after 15 days of growth in complete medium in 96 well ultra-low adherent plates. Plating density ranges from 100 to 0.01 cells/well. **p<0.01 vs. GBM1-PRP-KO cells, °°p<0.01 vs. GBM2-PRP-KO cells.
