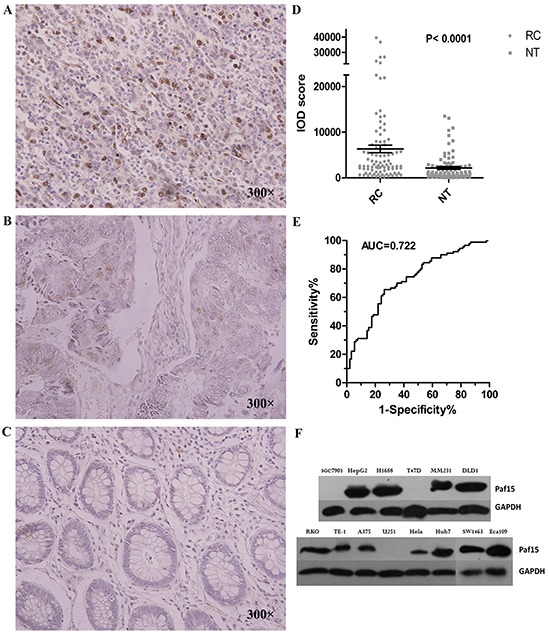
Figure 1. Expression of Paf15 in RC.

A. Strong positive image in RC. Staining is indicated by brown color in nuclei. B. Modest positive image: several cells showed less intense nuclear staining. C. Negative Paf15 expression. D. Paf15 expression levels in paired normal colorectal cancer and adjacent normal tissue (n = 105) as shown normalized by IOD score. E. ROC curve analysis for Paf15 expression. The area under the curve (AUC) was 0.722; F. Paf15 expression levels in multiple cancer cell lines.
