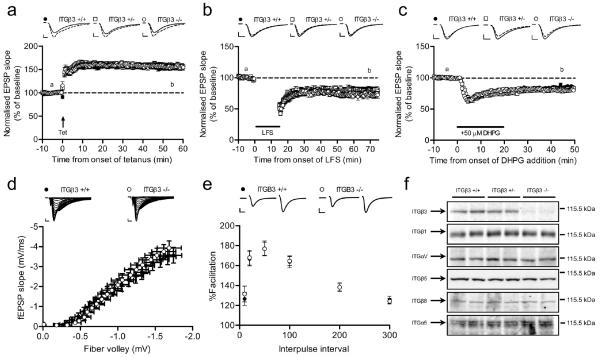
Figure 4.
Loss of ITGβ3 does not affect LTP or LTD. (a-c) Tetanus-induced LTP, LFS-induced LTD or mGluR-LTD induced by 3,5-(S)-DHPG are not changed in acute hippocampal slices from ITGβ3 KO mice [LTP: +/+ (n = 6, 20), +/− (n = 7, 20), −/− (n = 6, 18); LFS-LTD: +/+ (n = 7, 14), +/− (n = 5, 10), −/− (n = 7, 10); mGluR-LTD: +/+ (n = 7, 16), +/− (n = 5, 14), −/− (n = 6, 14)]. Representative traces are from time points “a” (solid) and “b” (dashed). (d) I/O curve is normal in ITGβ3 KO slices (n = 3, 25) compared to wild type littermate slices (n = 3, 20). (e) PPF (slope 2/slope 1) is normal in ITGβ3 KO slices (n = 13, 3) compared to wild type controls (n = 13, 3). Inter-pulse intervals are 10 ms, 20 ms, 50 ms, 100 ms, 200 ms and 300 ms. Example traces are from 50 ms inter-pulse interval. Scale bars = 5 ms, 0.5 mV. (f) Loss of ITGβ3 does not affect expression of other integrin subunits. Western blot analysis of P2 synaptosome samples prepared from ITGβ3 +/+, ITGβ3 +/− and ITGβ3 KO mice. The expected size and position of indicated integrin subunits are shown at right. Equal loading was confirmed by blotting for actin on the same membrane.

