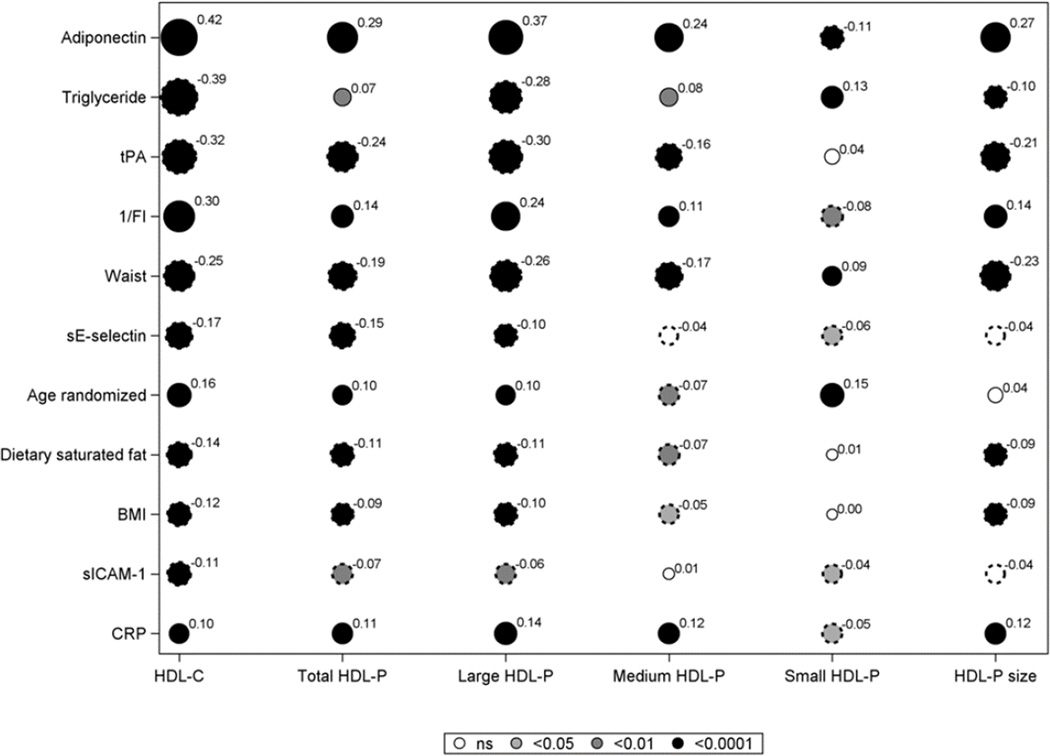
Figure 2.
Spearman correlation coefficients for baseline values of lifestyle, metabolic factors, and biomarkers with HDL-C, total HDL-P and HDL-P subfractions, and HDL size.
Solid circles indicate a positive correlation and scalloped circles a negative correlation. The diameter of each circle is proportional to the absolute value of the correlation shown as a superscript. The shading reflects the p-value: white for p>0.05; light grey for p<0.05 and medium grey for p<0.01 and black for p<0.0001. Variables with correlation of less than 0.1 with HDL-C are not shown.

