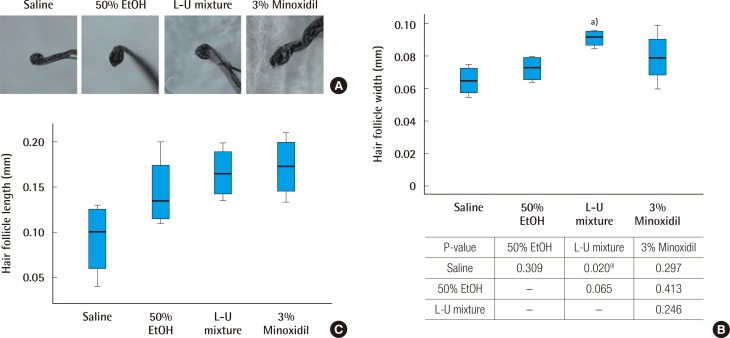
Fig. 2. Comparison of hair follicle width and length.
(A) Picture of collected hair follicles (×300). (B) Analysis of hair follicles, measured at the greatest width. The Kruskal-Wallis test was used to compare the value of hair growth score. The result was statistically significant (P=0.040). The multiple comparison was performed by the Dunn procedure. (C) Analysis of hair follicles, measured at the greatest length. L-U mixture, the extract of Laminaria japonica and Undaria pinnatifida. a)P-value, significantly different than the normal saline group.

