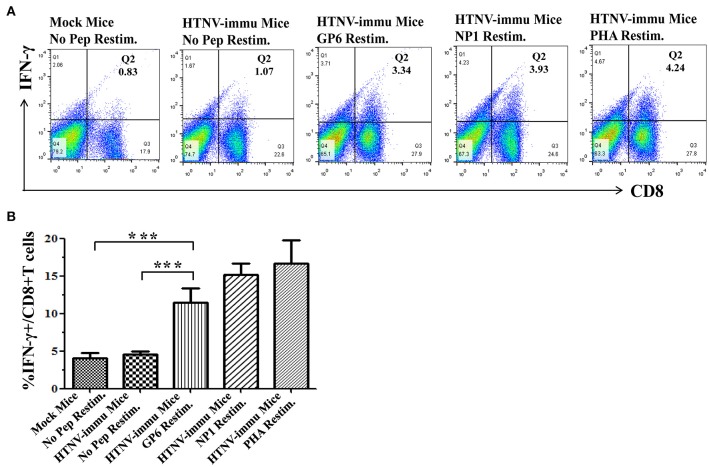
Figure 3.
The rapid secretion of IFN-γ after recognition of the HTNV-specific peptide. (A) Representative flow cytometric plots of IFN-γ production by peptide-specific CD8+ T cells. The upper lane (A) shows the results 4 h after peptide restimulation and both negative and positive controls, and the lower lane (B) shows the frequency of IFN-γ production in CD8+ T cell populations. Data are expressed as the mean ± SEM (n = 6). ***P < 0.0001.

