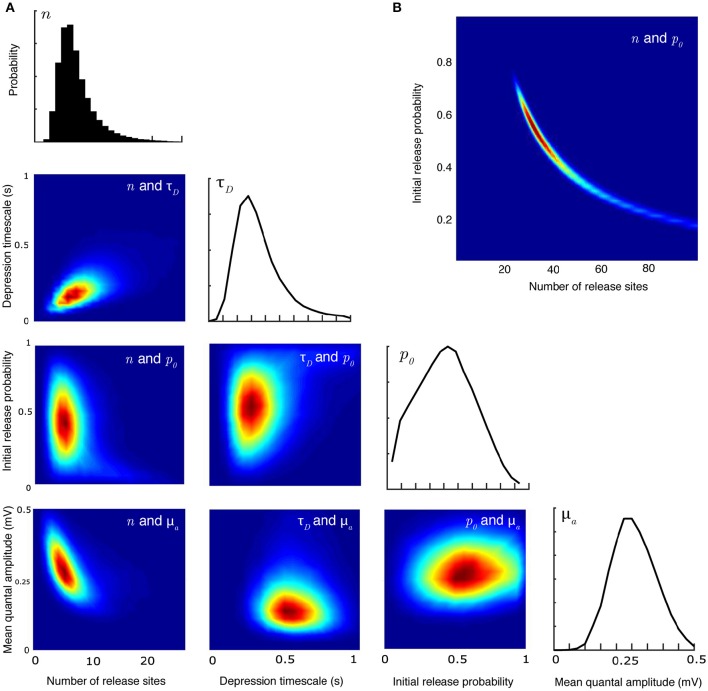
Figure 2.
Joint parameter estimates for the synaptic-dynamics model. (A) Pairwise and individual posterior marginals for release-site number n, depression timescale τD, initial release probability p0, and mean quantal amplitude μa. True parameter values and data are the same as Figure 1. Colorbars for the values of the posterior distributions are not shown; the relative differences in value show the shape and sharpness of the pairwise posteriors for each pair of parameters. (B) Pairwise posterior marginal for release site number n and initial release probability p0 for a case where the true values were n = 35 and p0 = 0.50 showing a strong anticorrelation. All posteriors shown after 106 Metropolis-Hastings samples.

