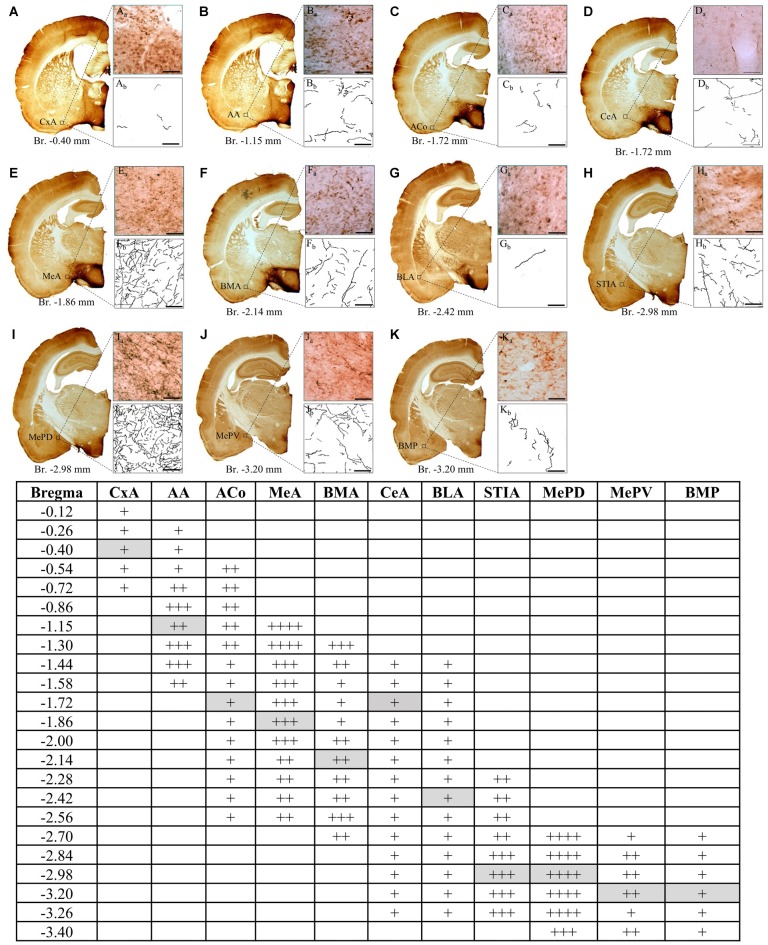
Figure 1.
Distribution of vasopressin-immunostained fibers through the rostrocaudal extent of amygdala in the rat. Low (A–K) and high power (Aa–Ka) photomicrographs and tracings of arginine-vasopressin (AVP) labeled fibers (Ab–Kb) in coronal sections, illustrating the heterogeneous distribution in the density of AVP fibers among different amygdalar regions. The highest density was found in the MePD region at Bregma level −2.70 mm (panel I, and table). Each of the panels from (A–K) corresponds to a representative example at the bregma level indicated in the table gray boxes. For the semiquantitative analysis in the table, the summed length (calculated with ImageJ) of fibers in a 0.04 mm2 area, inside this highest density region was assigned as 100%, regions with summed lengths between 76–100% were assigned as ++++; between 51–75% : +++; between 26–50%: ++ and between 1–25%: +. Anatomical maps and nuclei nomenclature are from the rat atlas of Swanson (2003). CxA, cortico-amygdalar transition zone; AA, anterior amygdala area; Aco, anterior-cortical amygdaloid nucleus; MeA, medial anterior amygdaloid nucleus; BMA, basomedial anterior amygdaloid nucleus; CeA, central nucleus of amygdala; BLA, basolateral amygdala; STIA, stria terminalis intra-amygdaloid division; MePD, medial postero-dorsal amygdaloid nucleus; MePV, medial postero-ventral amygdaloid nucleus; BMP, basomedial posterior amygdaloid nucleus. Scale bars in (Aa–Ka, Ab–Kb) 50 μm, Bregma levels are indicated below each low power photomicrograph. Squared region indicates the 200 μm area used for calculation of summed length for each amygdala region.

