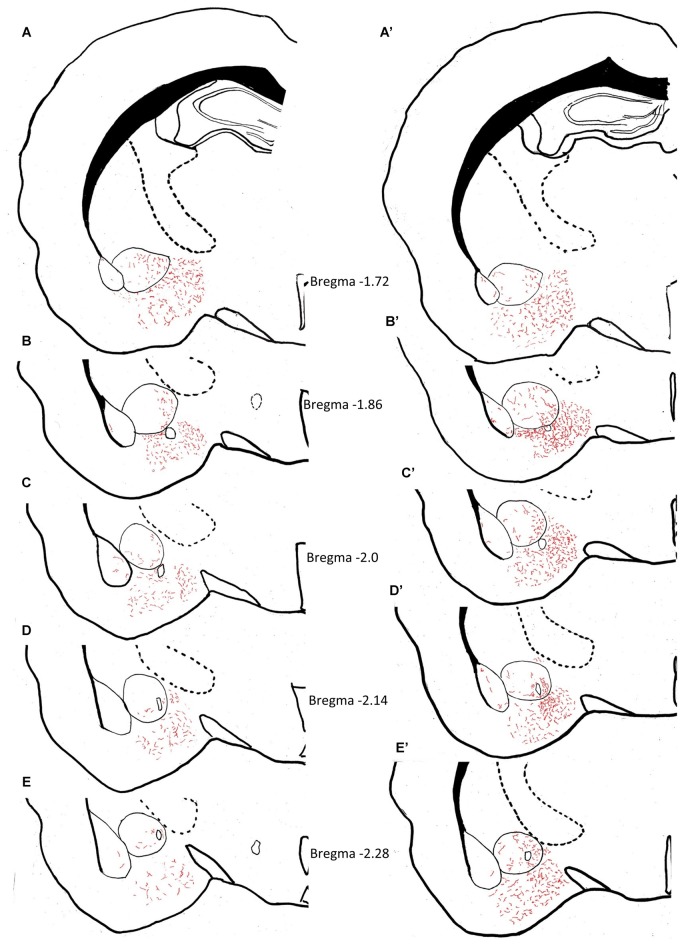
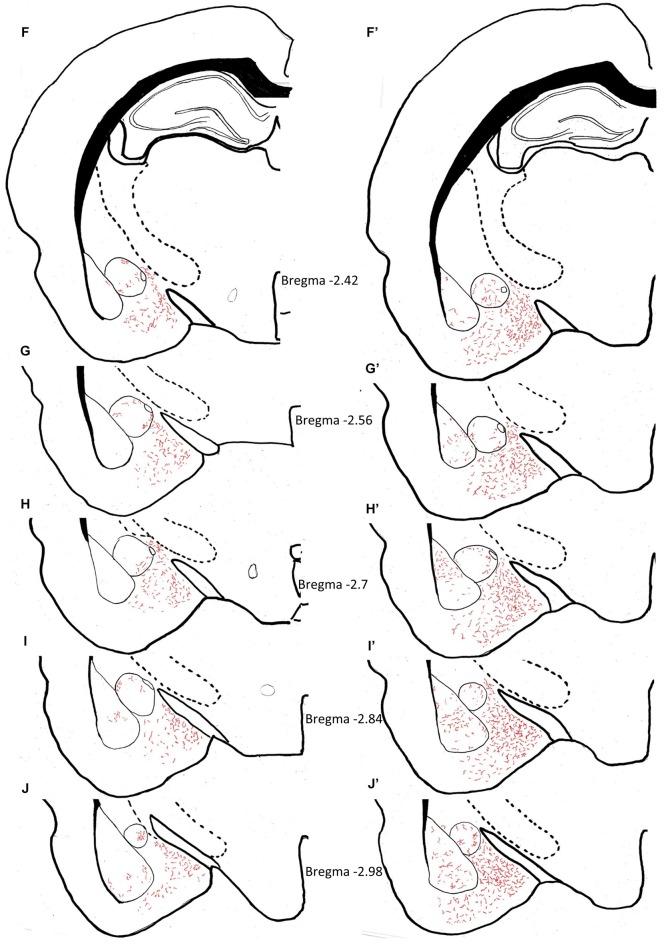
Figure 3.
Anatomical charting of AVPir+ fiber distribution in amygdala in both control (A–J) and maternal separation (MS) male adult rat (MS, A’–J’). Chartings of coronal sections at 10 rostro-caudal levels with line drawings referenced with microscopic observation, representing AVP fiber distribution through the entire amygdaloidal complex. Note the remarkable increase in AVP innervation densities in all regions of the amygdala as a function of MS.


