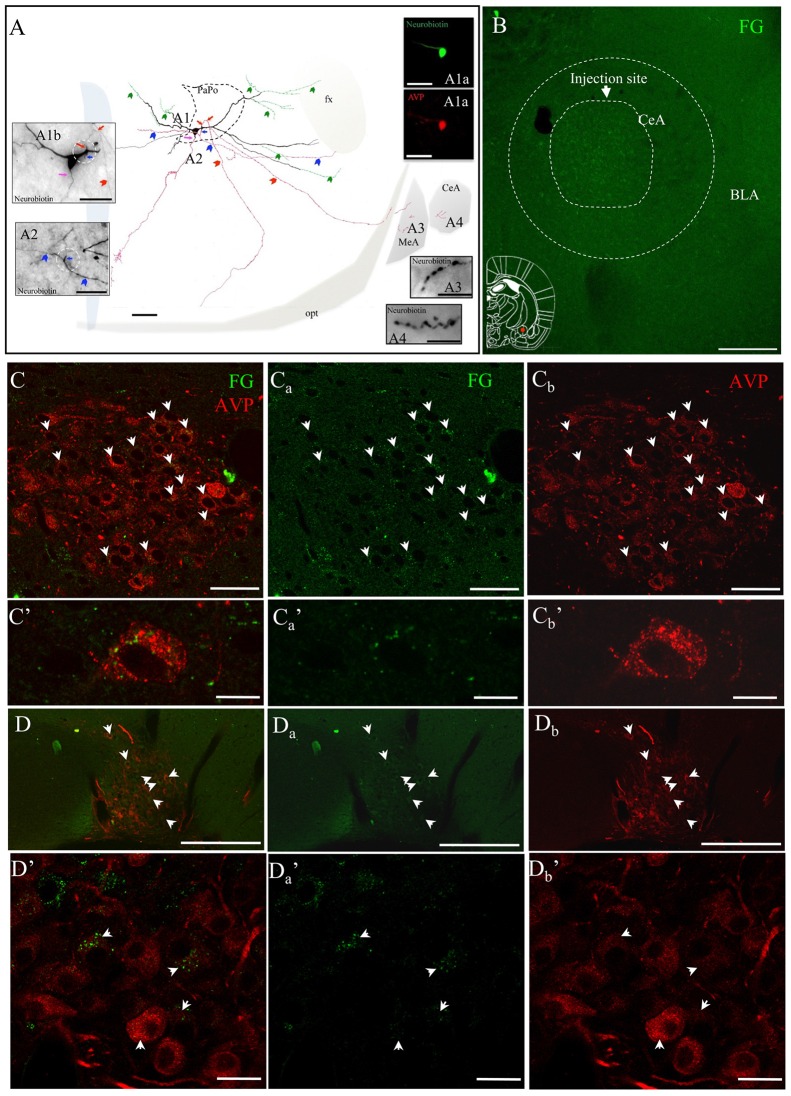
Figure 5.
AVP-containing magnocellular neurons innervate the CeA. (A) Camera lucida reconstruction of the coronal projection and corresponding photomicrographs (insets) showing the dendritic and axonal patterns of an anterogradely labeled AVP-containing magnocellular neurosecretory neuron sending axon collaterals to the medial and CeA. This panel was modified from Hernández et al. (2015), see the original publication for method descriptions. Red, blue and pink arrows indicate the origins of three parent-axons. Red and blue arrowheads indicate the subsequent axonal branches. The green arrowheads indicate the beaded processes originated from the dendritic processes, some of them entering the fornix (green arrowheads). Such processes were described in an early study and were considered as axonal processes (Sofroniew and Glasmann, 1981). (A1a) AVP-containing nature was ascertained by AVP immunoreaction; (A1b) neurobiotin-peroxidase-AB complex histochemical reaction showing the morphology of the filled AVPir+ neuron’s soma and its three parental axons emitted from proximal dendrites (pink, red and blue arrows indicate the sites where the axons were originated). Note that two of those axons were emitted from the same proximal dendritic point (red and blue arrows but coursed to opposite directions). (A2) Photomicrograph of the section contiguous caudally to the section of soma (A1b) showing the branching of the axon collaterals (colors are aimed to encode each group of collaterals originated from the same parental main axon). (A3,A4) show axonal processes found in amygdala. Scale bars: 100 μm for (A) 50 μm for all photomicrographs. MeA, medial amygdala; CeA, central amygdala; opt, optical tract; fx, fornix. Panel (B) Fluorogold (FG; retrograde neural tracer) was iontophoretically injected into CeA. (Cs) panels correspond to the retrograde labeling images of the PVN with FG, AVPir and overlapping of the two channels respectively. (C’s) show an example of a magnocellular AVPir+ neuron in high magnification. Note that the green dots, which correspond to FG, are peri-nuclear which likely are intra-lisosomal. (D,D’) are the corresponding images for supraoptic nuclear labeling. Scale bar: 50 μm.

