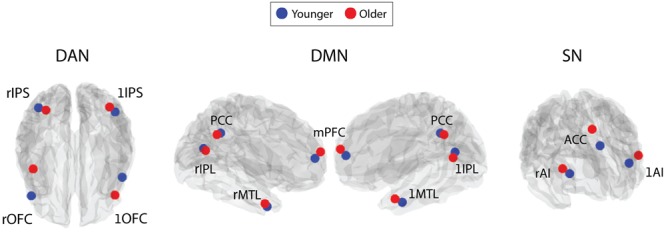
FIGURE 2.

Depiction of the peak z-statistic voxel location, around which 5×5×5 voxel ROIs were made, for each RSN node. These were defined from gICAs performed on: an independent cohort of 55 younger participants (blue); and 20 older participants (red). L and R prefixed before node names indicates the left and right hemispheres. MNI co-ordinates for these voxels are presented in Table 1.
