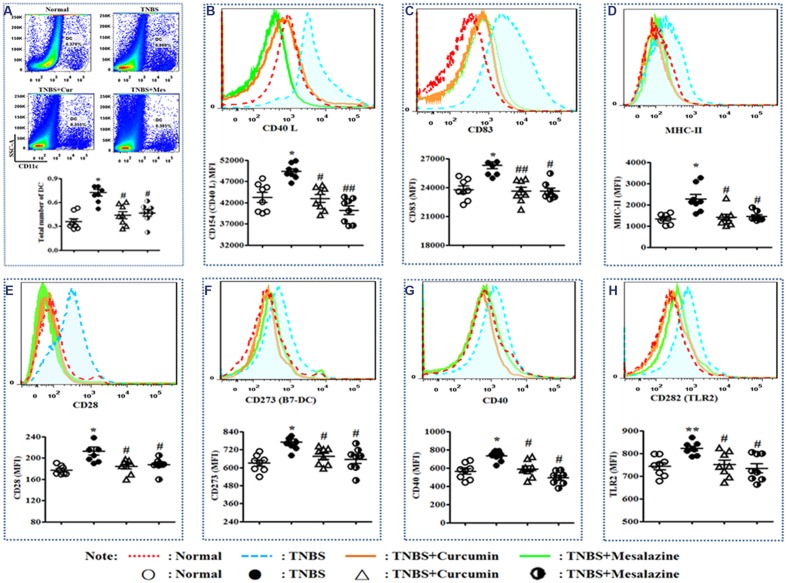
FIGURE 2.
Typical pseudocolor and level of costimulatory molecules of Dendritic cell (DC). (A) Typical pseudocolor and totality (%) of DC. (B) Typical pseudocolor and level (MFI) of CD40 L. (C) Typical pseudocolor and level (MFI) of CD83. (D) Typical pseudocolor and level (MFI) of MHC-II. (E) Typical pseudocolor and level (MFI) of CD28. (F) Typical pseudocolor and level (MFI) of CD273 (B7-DC). (G) Typical pseudocolor and level (MFI) of CD40. (H) Typical pseudocolor and level (MFI) of CD 282 (TLR2). Data were presented as mean ± SEM (n = 8). ∗p < 0.05 and ∗∗p < 0.01 versus the Normal group; #p < 0.05 and ##p < 0.01 versus the TNBS group.

