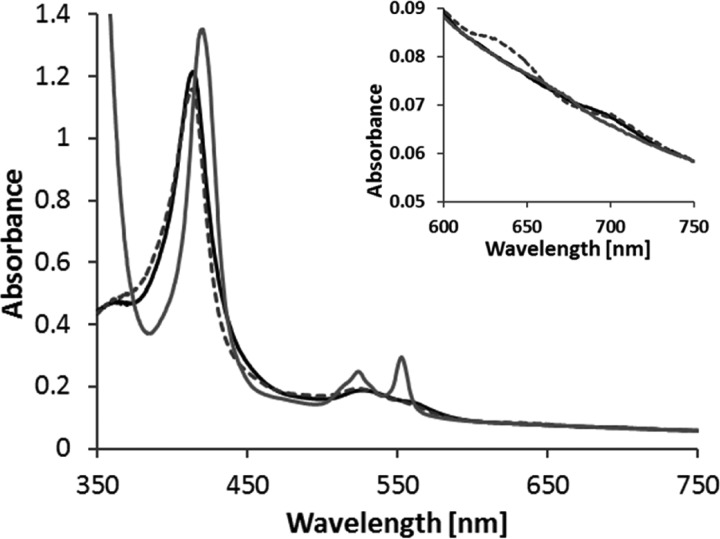
FIGURE 6.
UV-visible spectra of MpTsdBA. As the protein is slightly reduced in the “as isolated” state, 60 μm ferricyanide were added to record the oxidized spectrum (black line). For partial (gray broken line) and full reduction (gray line) of the protein, 0.33 and 5 mm sodium dithionite were added, respectively. 100 mm ammonium acetate buffer, pH 5, with 200 mm NaCl was used, and spectra are normalized to 750 nm. The oxidized spectrum exhibits a 700-nm peak indicating methionine as heme iron ligand and the partially reduced protein exhibits a feature at 630 nm. Protein concentration was 3.3 μm.

