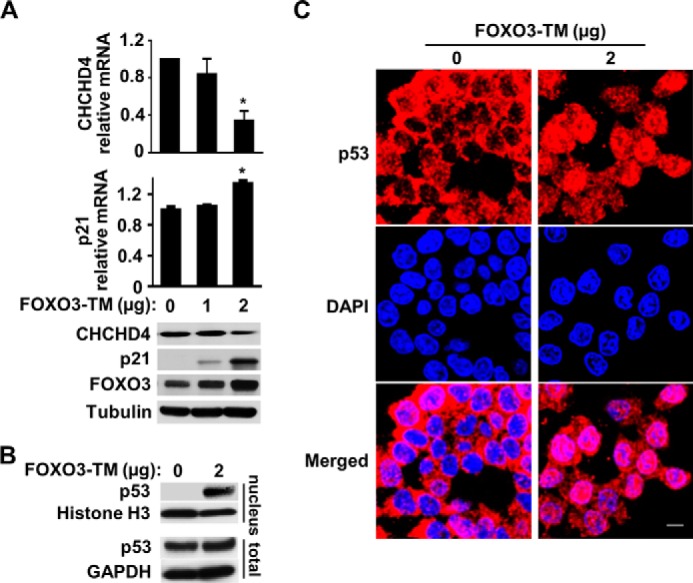
FIGURE 5.

FOXO3 represses CHCHD4 expression. A, expression levels of CHCHD4 and p21 in HCT116 cells transfected with the FOXO3-TM plasmid. n = 3. B, p53 immunoblot of nuclear fraction and total cell extract of HCT116 cells transfected with the FOXO3-TM plasmid. C, representative confocal immunofluorescence images of p53 (red) in FOXO3-TM-transfected cells. DAPI stain (blue) shows nuclei. Values are mean ± S.E. *, p < 0.001. Scale bar = 10 μm.
