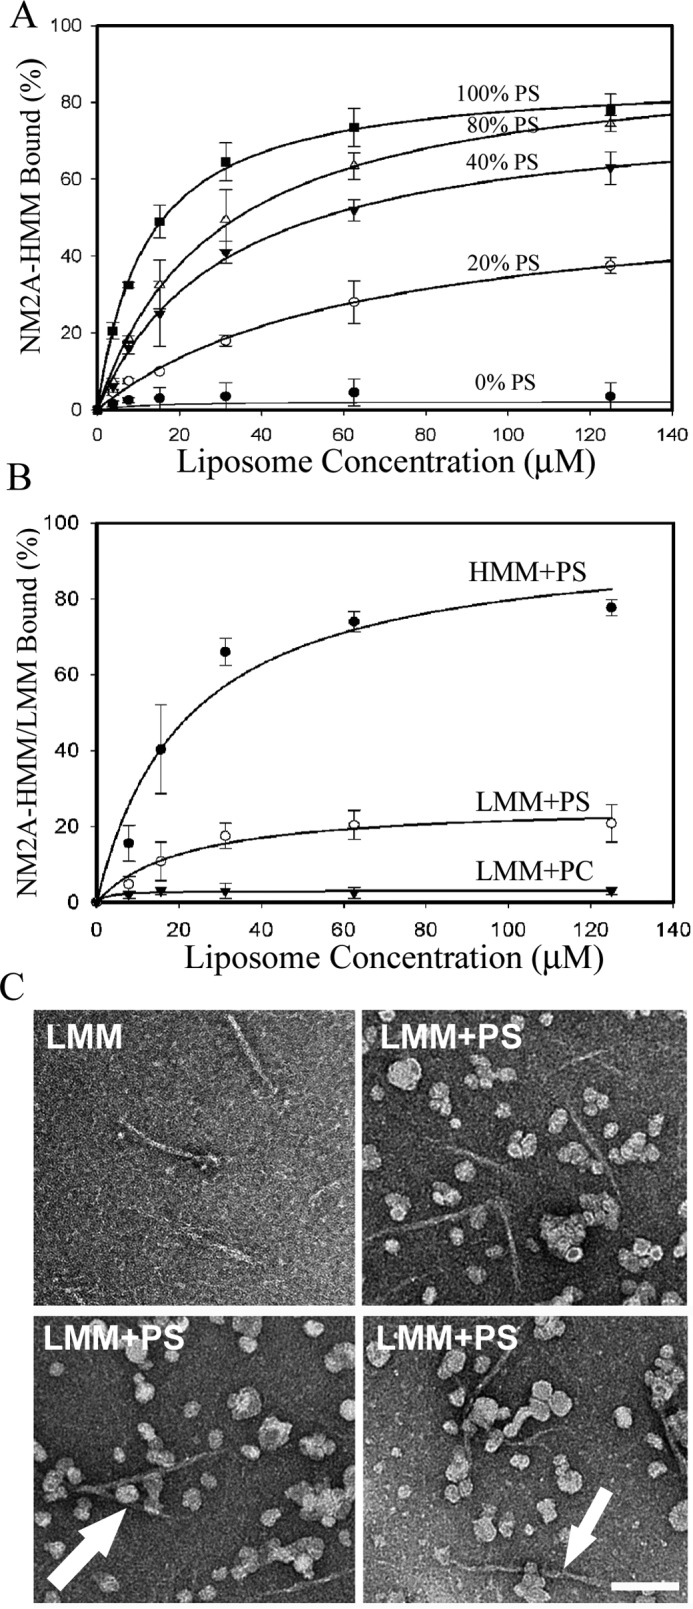
FIGURE 5.

Quantification of binding of NM2A-HMM and NM2A-LMM to PS-liposomes. A, binding of 100 nm HMM to PS-liposomes as a function of liposome concentration and percentage of PS in liposomes composed of PS and PC. B, 100 nm LMM bound to 100% PS-liposomes much more weakly than 100 nm HMM. C, negatively stained EM images of a mixture of 100 nm LMM filaments and 125 μm PS-liposomes show only a few possibly liposome-bound LMM (arrow). The data in A and B are the average and S.D. of at least three experiments. The bar is 100 nm.
