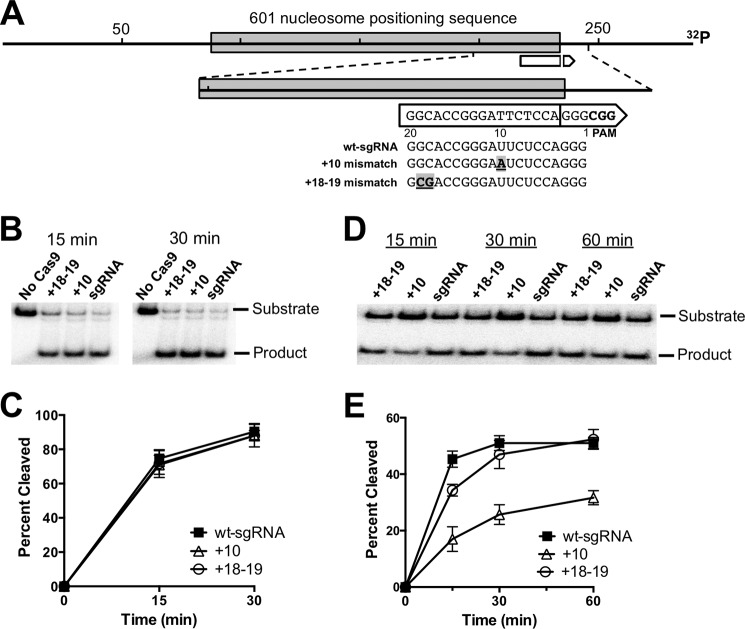
FIGURE 1.
Time course of Cas9 cleavage on naked DNA and nucleosome substrates containing sgRNA-target DNA mismatches. A, diagram showing the location of mismatches within the sgRNA relative to the DNA target (white arrow) in the 289-bp substrate containing the 601 nucleosome positioning sequence. The break in the arrow denotes the Cas9 cleavage site, and the point of the arrow corresponds to the PAM site. The locations and sequences of the sgRNA mismatches are indicated, with the mismatch location (e.g. +10) denoting nucleotide distance from the PAM. B, representative polyacrylamide gels showing the full-length substrate and Cas9 cleavage product of the naked DNA substrate for each sgRNA at different time points. No Cas9 represents control samples with only the wt-sgRNA. C, graph showing the percentage of cleavage of the naked DNA substrate as a function of time. Data points represent the average of three independent experiments, and error bars represent standard deviations. D, same as in panel B, except showing the time course of Cas9 cleavage of nucleosome substrate. E, summary of Cas9 cleavage of nucleosome substrates for the indicated sgRNAs. Data points represent the average of three independent experiments, and error bars represent standard deviations.

