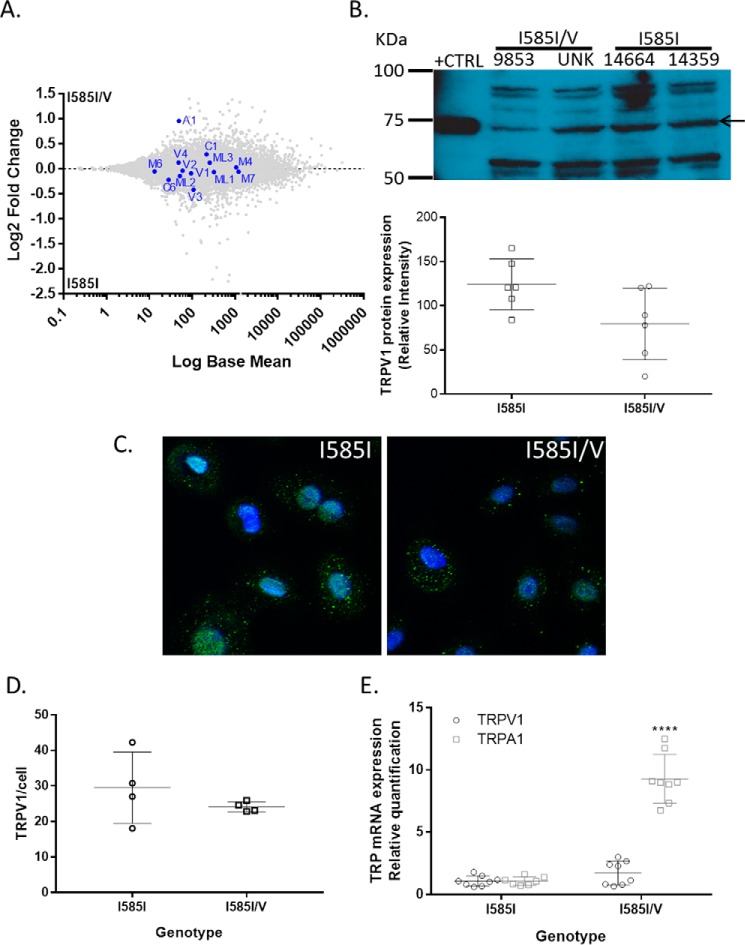
FIGURE 5.
Comparison of TRP channel expression in primary NHBE cells expressing either wild-type TRPV1 (I585I; donors 9853 and unknown (UNK)) or I585I/V (donors 14664 and 14359). A, log ratio/mean average plot of RNA sequencing data comparing TRP channel gene expression as a function of TRPV1-I585 genotype. B–D, comparison of TRPV1 protein expression by Western blotting (B) and immunocytochemistry (C and D). E, confirmation of increased TRPA1 mRNA expression by quantitative PCR. Western blotting data represent the mean ± S.D. (error bars) relative to total protein. Blue (Hoechst 33342), nuclei; green (Alexa Fluor 488-conjugated antibody), TRPV1. Immunostaining was quantified in ImageJ by counting the number of green punctate foci per cell, representing TRPV1, and normalizing to the number of cells/nuclei, providing the number of TRPV1-positive foci/cell. Data were analyzed for significant differences from the I585I wild-type control group using a t test. **** represents p < 0.0001.

