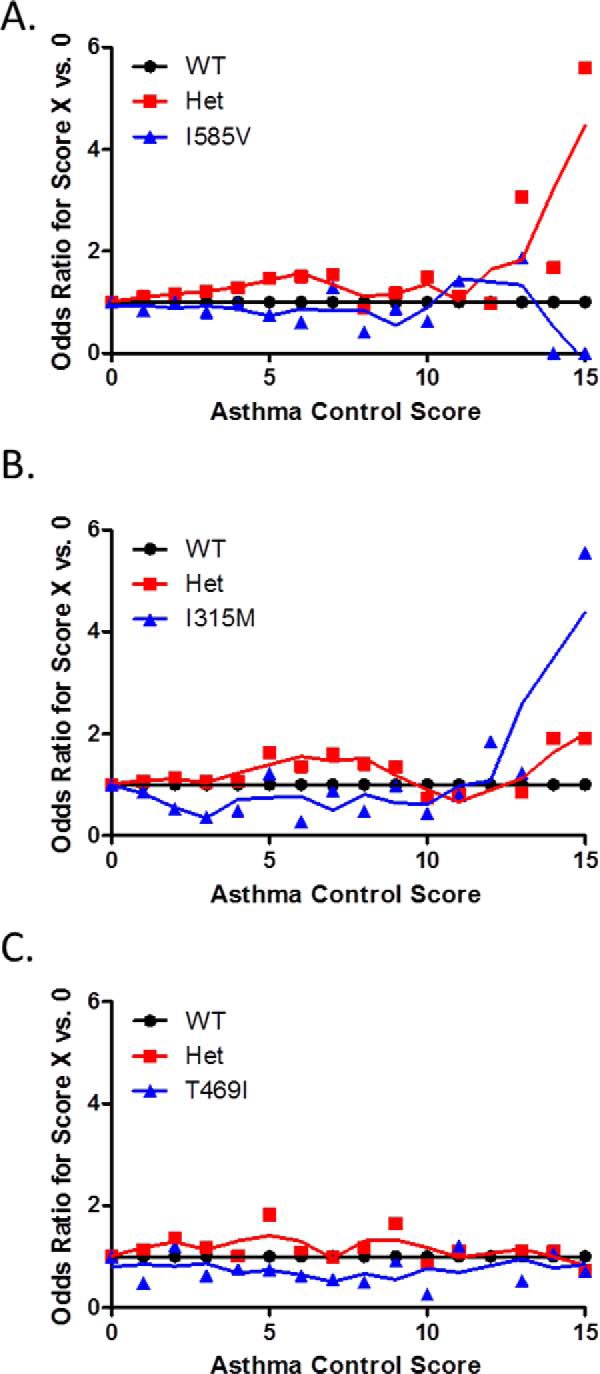
FIGURE 6.

Simple OR values for subjects having an aggregate asthma control score of “X” versus 0, representing ideal asthma symptom control, as a function of TRPV1 genotype. A, I585V; B, I315M; C, T469I. OR calculations were performed using MedCalc. Het, heterozygote.
