FIGURE 4.
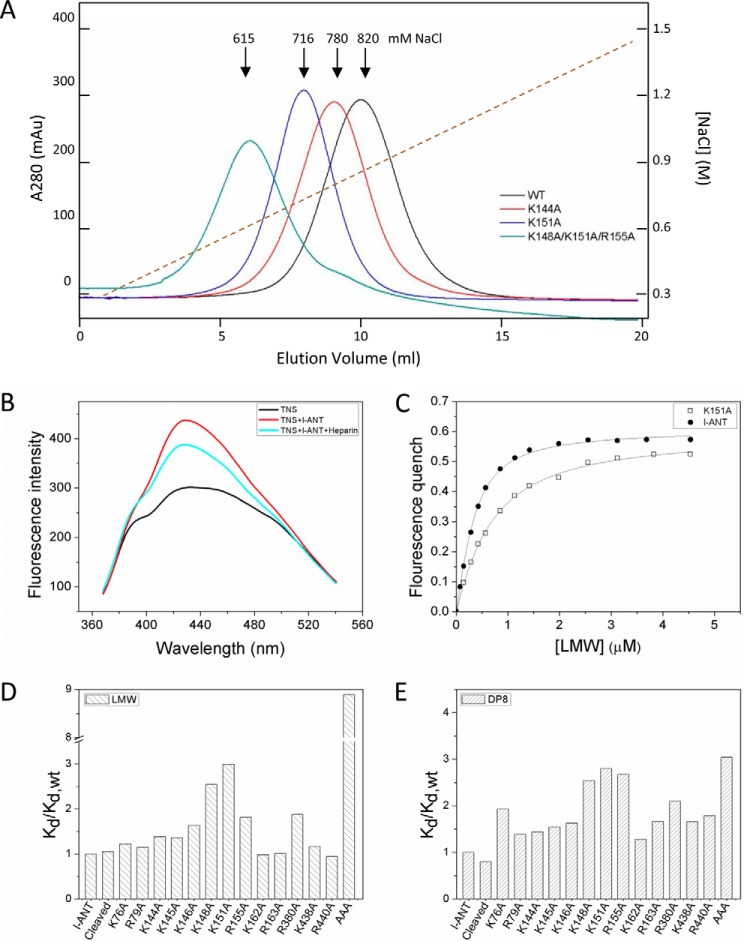
Identification of heparin binding site. A, heparin column affinity of l-ANT variants. l-ANT variants were loaded onto a 1-ml heparin column and eluted with a 20-column volume (x axis) with a gradient of 0.3–1.5 m NaCl (right y axis, brown dashed line). The left y axis shows the absorption value at 280-nm wavelength. Wild type l-ANT (black line) is eluted at 820 mm NaCl. Variants K144A (red line) and K151A (blue line) are eluted at about 780 mm NaCl and 716 mm NaCl, respectively. The variant K148A/K151A/R155A (termed AAA, green line) is eluted at about 615 mm NaCl. The exact values of NaCl concentrations in elution peaks are listed in Table 2. B, fluorescence spectrum of TNS. The fluorescence spectrum of 5 μm TNS alone is given as a black line. The TNS fluorescence intensity increases with the addition of 0.3 μm l-ANT (red line) and decreases in response to the addition of 0.1 μm LMW heparin (cyan line). C, dissociation constants are non-linearly fitted by Equation 1 as described under “Experimental Procedures.” All titrations were performed in solutions containing 5–10 μm TNS in 50 mm Tris-HCl, pH 7.4, 20% glycerol, 0.1% PEG 8000. The ionic strengths were adjusted by adding NaCl. Filled circles, wild type l-ANT; open circles, K151A. D and E, column diagram of the relative dissociation constant values (Kd/Kd,wt) of the variants binding to LMW heparin (D) or 8-monosaccharide heparin (DP8) (E). The exact values are listed in Table 2.

